User Guide
Launch your browser and go to FAME’s URL. You should access the login page.
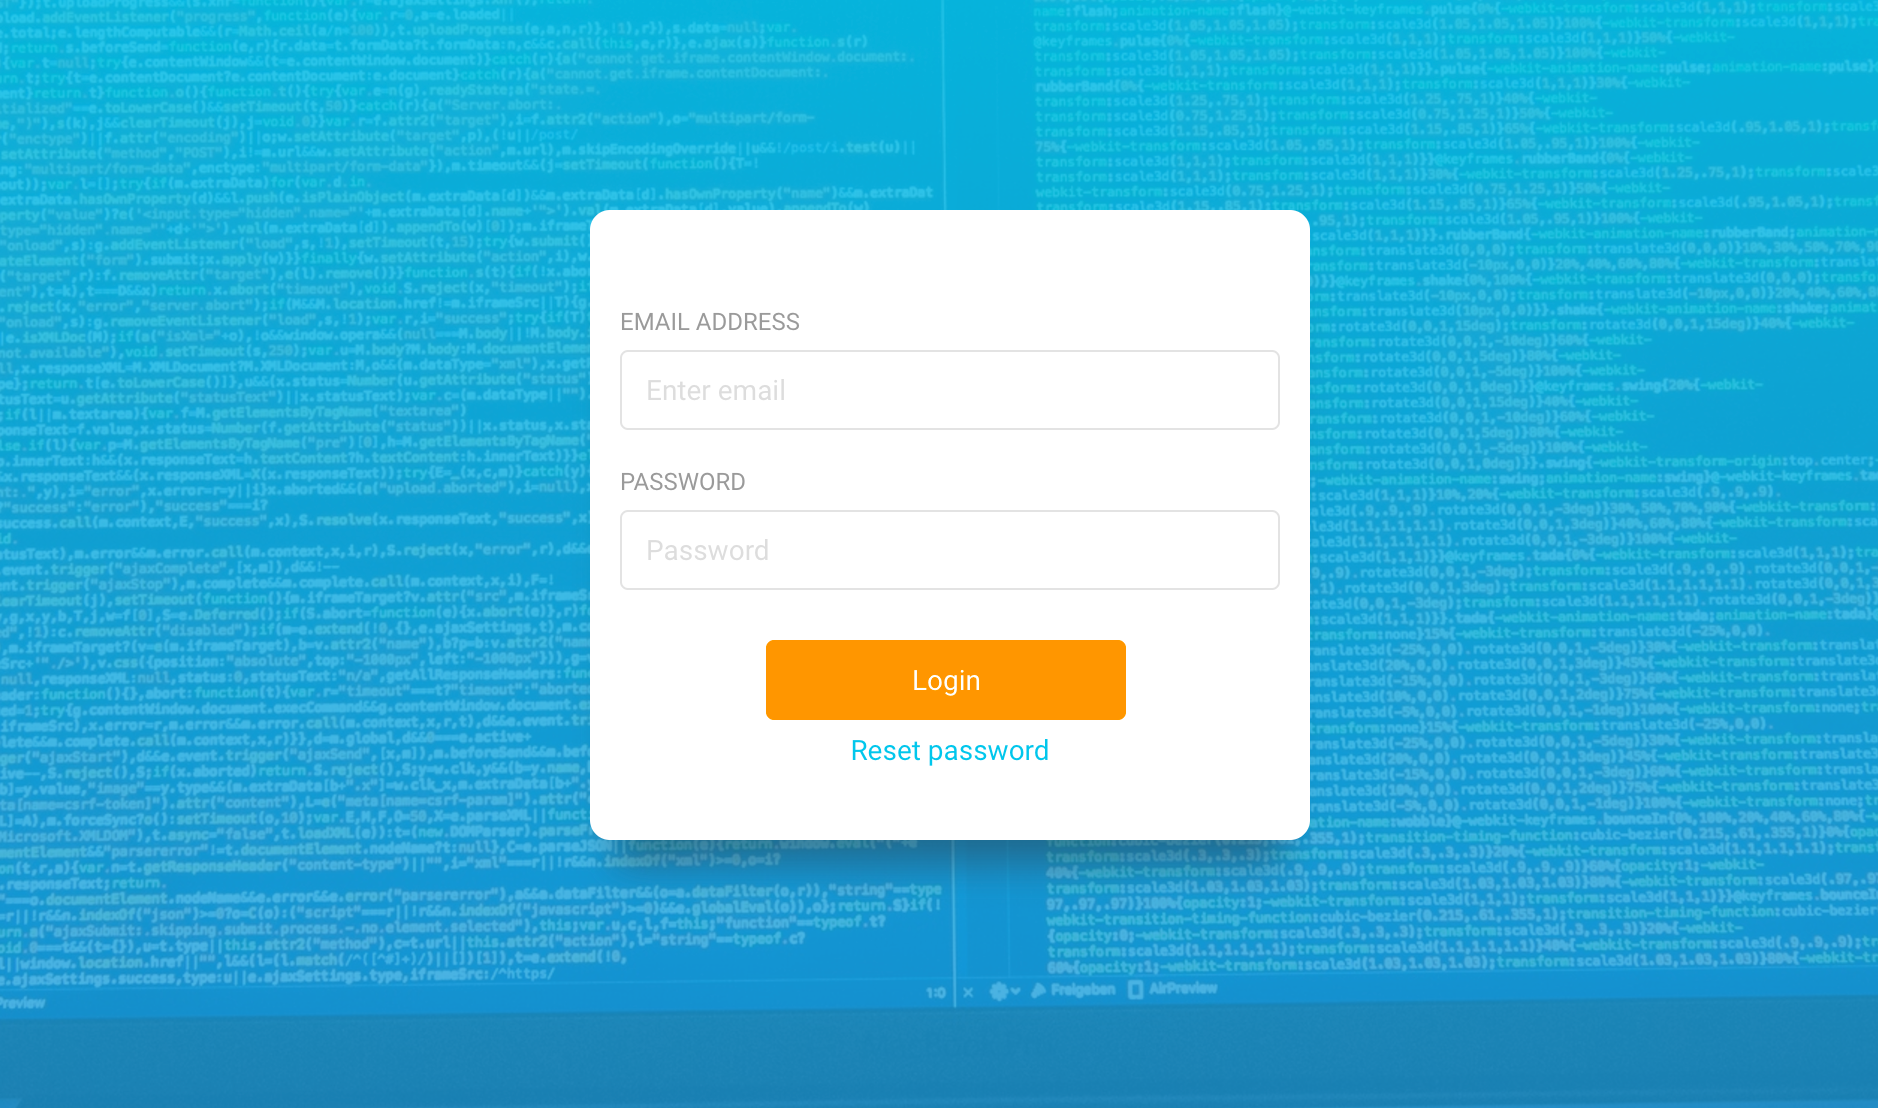
Log in using your email address and password.
Once logged in, the first page you will see is the Analyses page.
Menu
On the top of the page, you will find the following elements:

A search field
(1)A link to Configuration Tracking
(2)A link to Objects
(3)A link to Analyses
(4)A link to the Submission Page
(5)Access to your User Profile
(6)
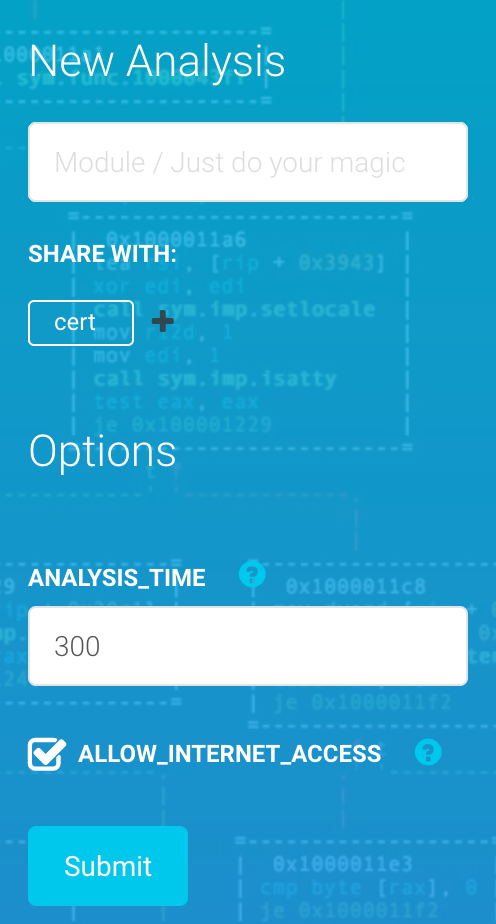
Submission Page
This page will enable you to analyze a new object.
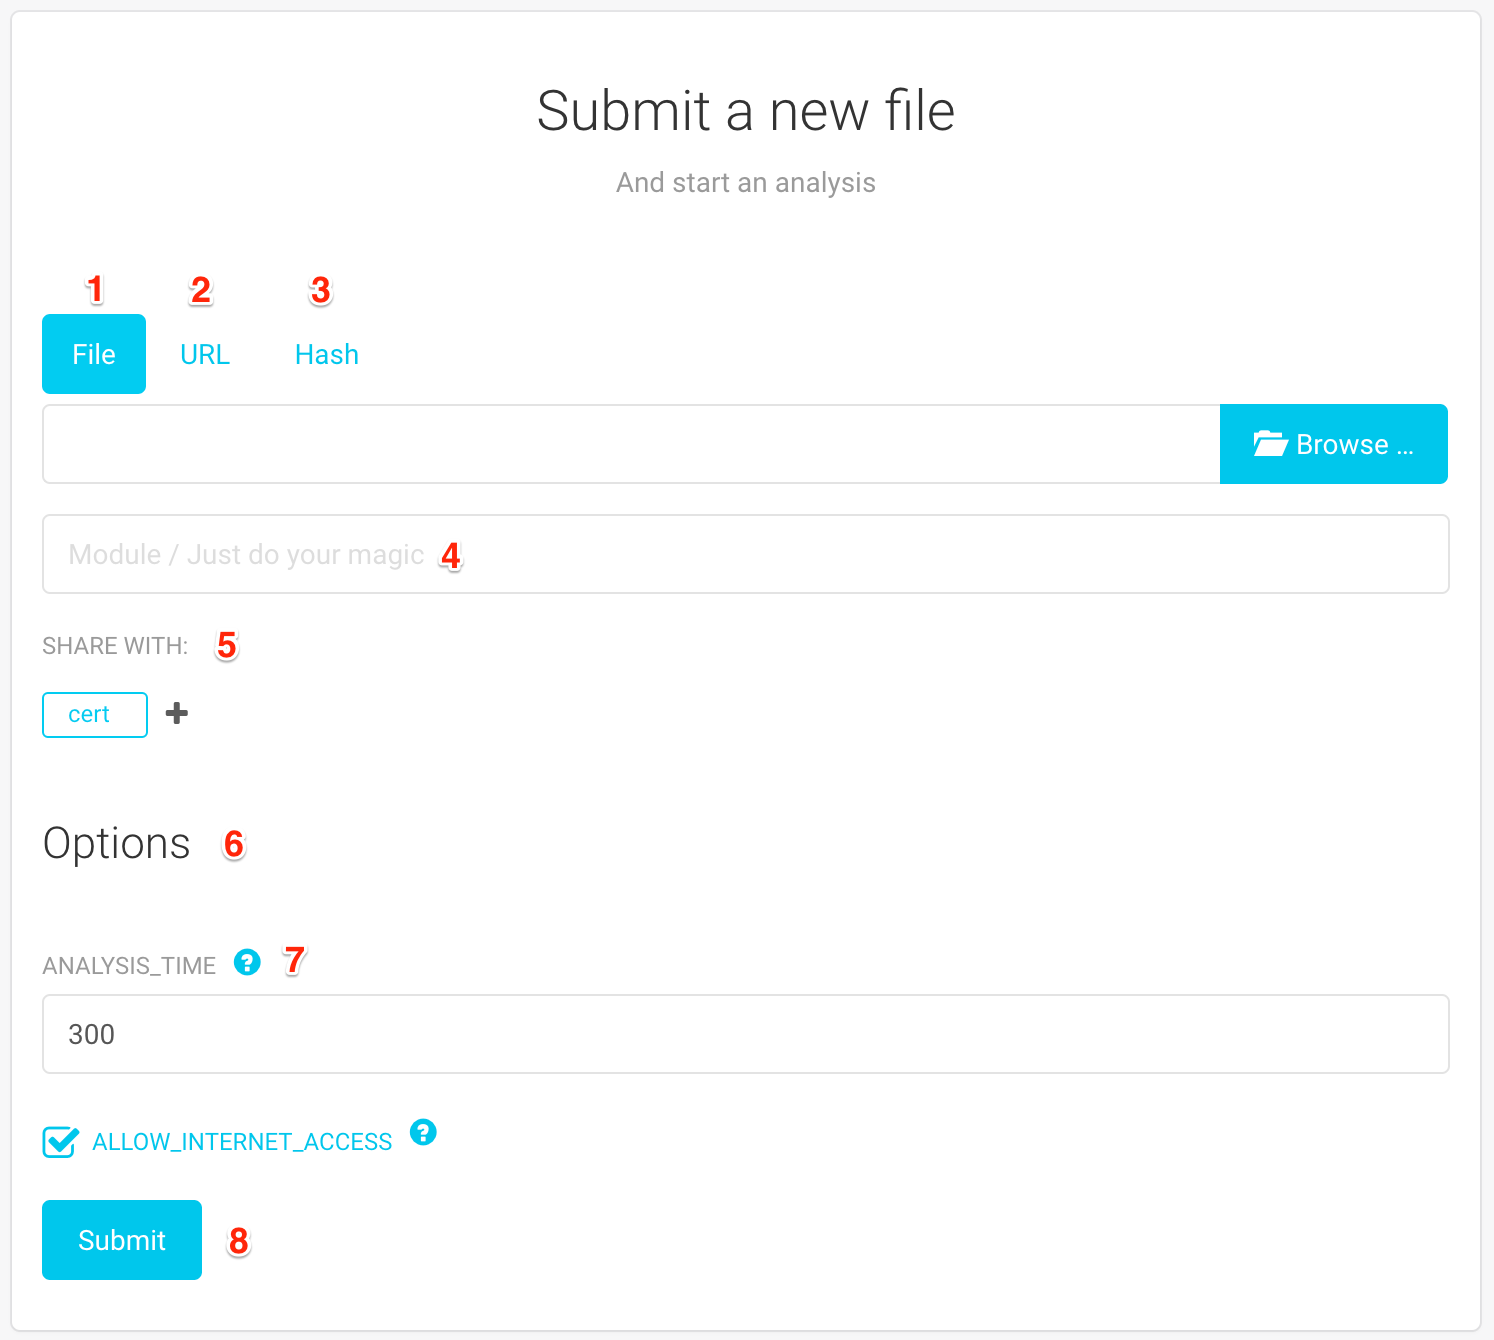
You can analyze several types of objects: a file (1), an URL (2) or a Hash (3). You should note the following:
When what you really want is to analyze a file that is available at a certain URL, you can submit the URL and specify the url_download module.
Submitting a Hash will try to run all available preloading modules sequentially until one of them could provide the sample.
Once you have selected the object you would like to analyze, you can select the module that should be executed (4). Leaving this field empty (by default) will perform a Just Do Your Magic analysis. This will most likely fit your needs. If you want to do a Targeted analysis, you can type and select the module of your choice in this field.
You have the possibility to change the sharing preferences (5) for this object. This is a list of groups that will have access to this object. Groups are not predefined. The default value can be changed in your User Profile.
Finally, you have a list of analysis options (6). These settings are defined by modules themselves and let you change some elements of the analysis.
Warning
Options are individually defined by modules. This means that they are not necessarily global. For example, the “ALLOW_INTERNET_ACCESS” option will only apply to certain modules.
If this is really important to you, you should verify to which modules a certain option apply, by clicking on the help button next to it (7)
Submit your analysis by clicking on the “Submit” button (8). This will redirect you the Analysis Details.
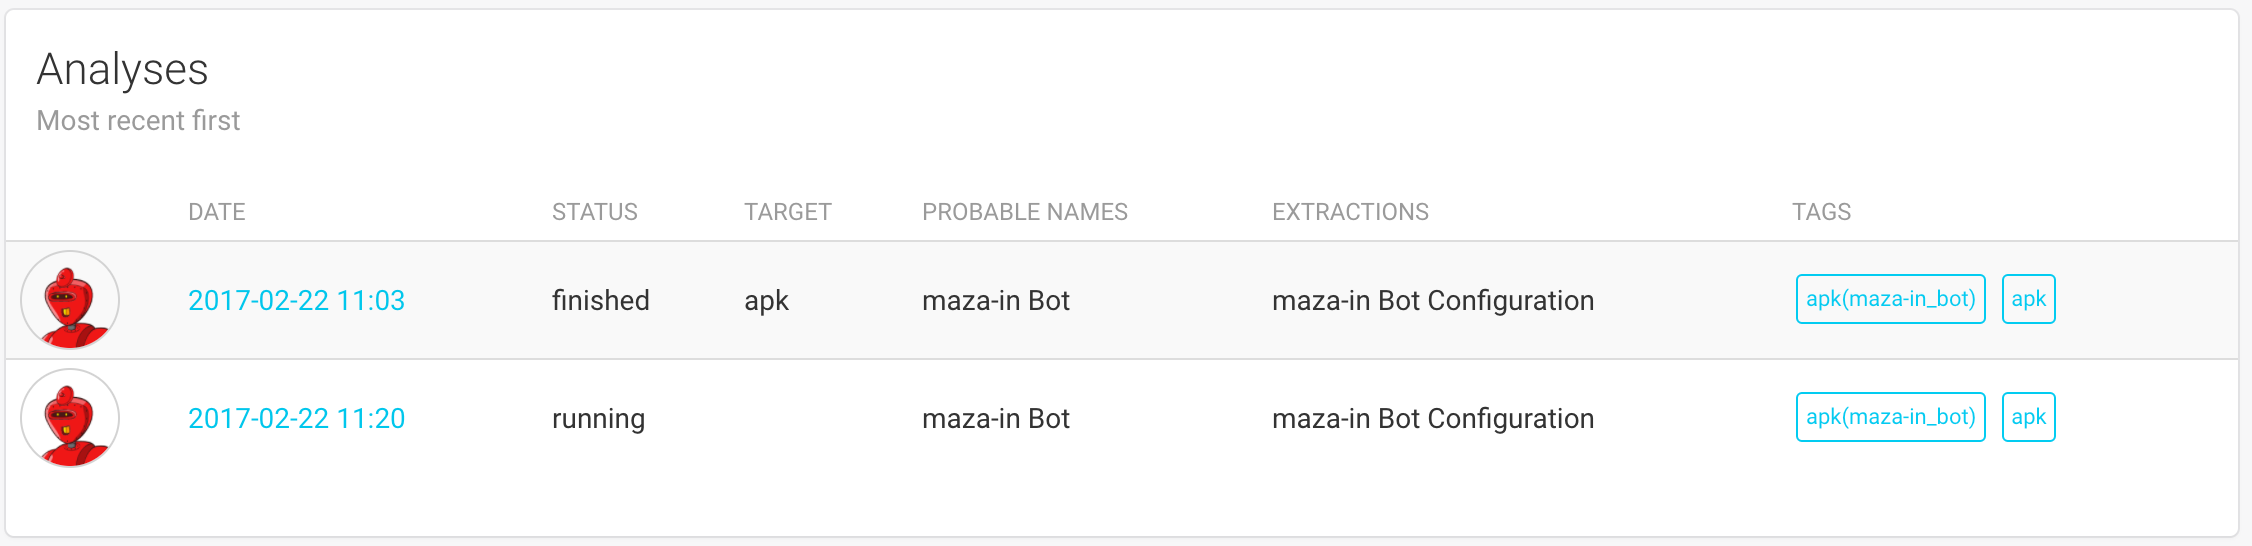
Analyses
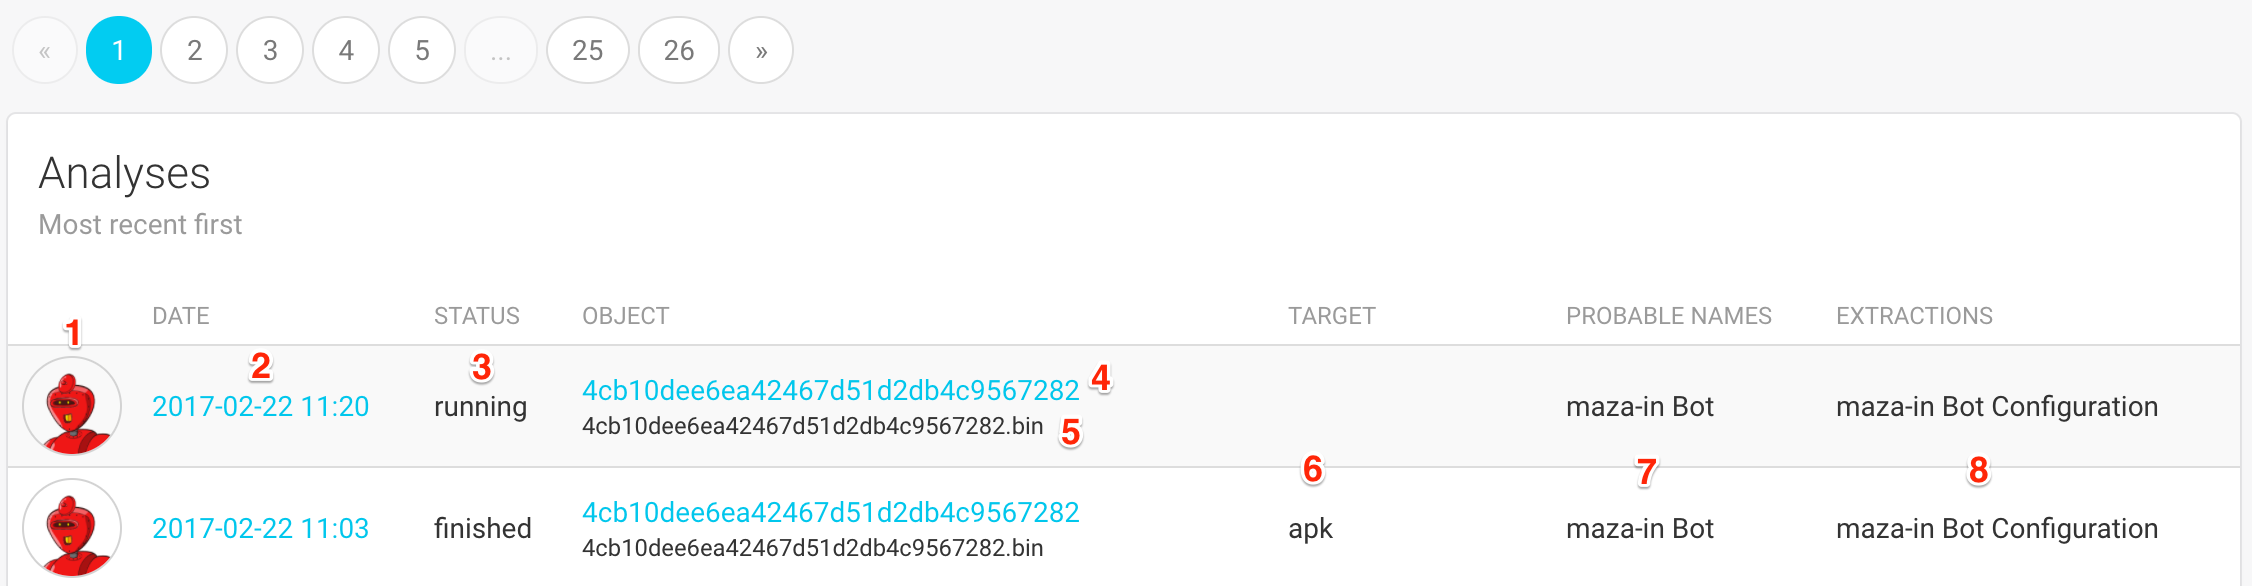
The list of analyses displays the following pieces of informations:
The avatar of the analyst that launched this analysis
(1). Hovering over the avatar will display the analyst’s full name.The date and time at which this analysis was created
(2). Clicking on the date will take you to the Analysis Details.The status of the analysis
(3). The status can be: pending (waiting for a worker to be available), running, finished or error.The MD5 hash of the object
(4)and a list of file names(5). Clicking on the MD5 will take you to the Analysis Details.The target
(6), which is the module that was selected at submission. An empty column means that this is a Just Do Your Magic analysis.Probable Names associated with this object
(7). Probable names are names of malware families that FAME was able to recognize.A list of extractions
(8).
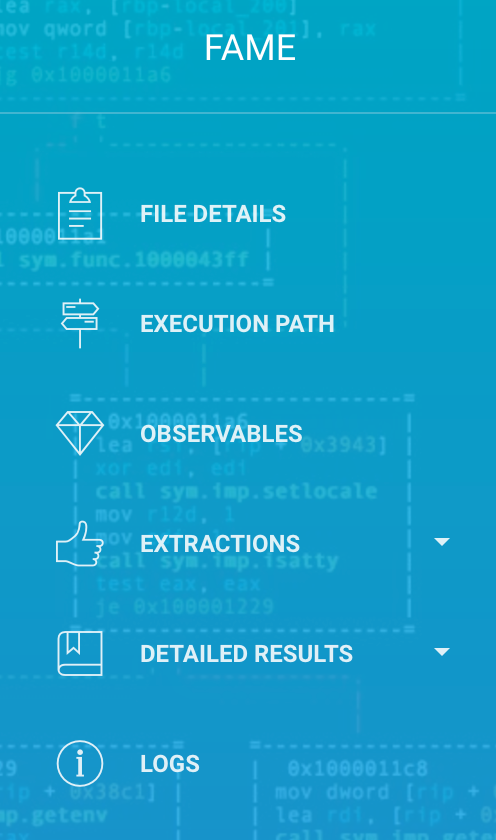
Analysis Details
This is the page that will display your analysis results, separated in different blocks. Everything is displayed on a single page, and blocks can be directly accessed with the sidebar menu.
Probable Names
The first piece of information that is displayed is the probable names, when FAME was able to recognize some malware families.

Object Details
This block displays basic information about the analyzed objects, as well as available actions:
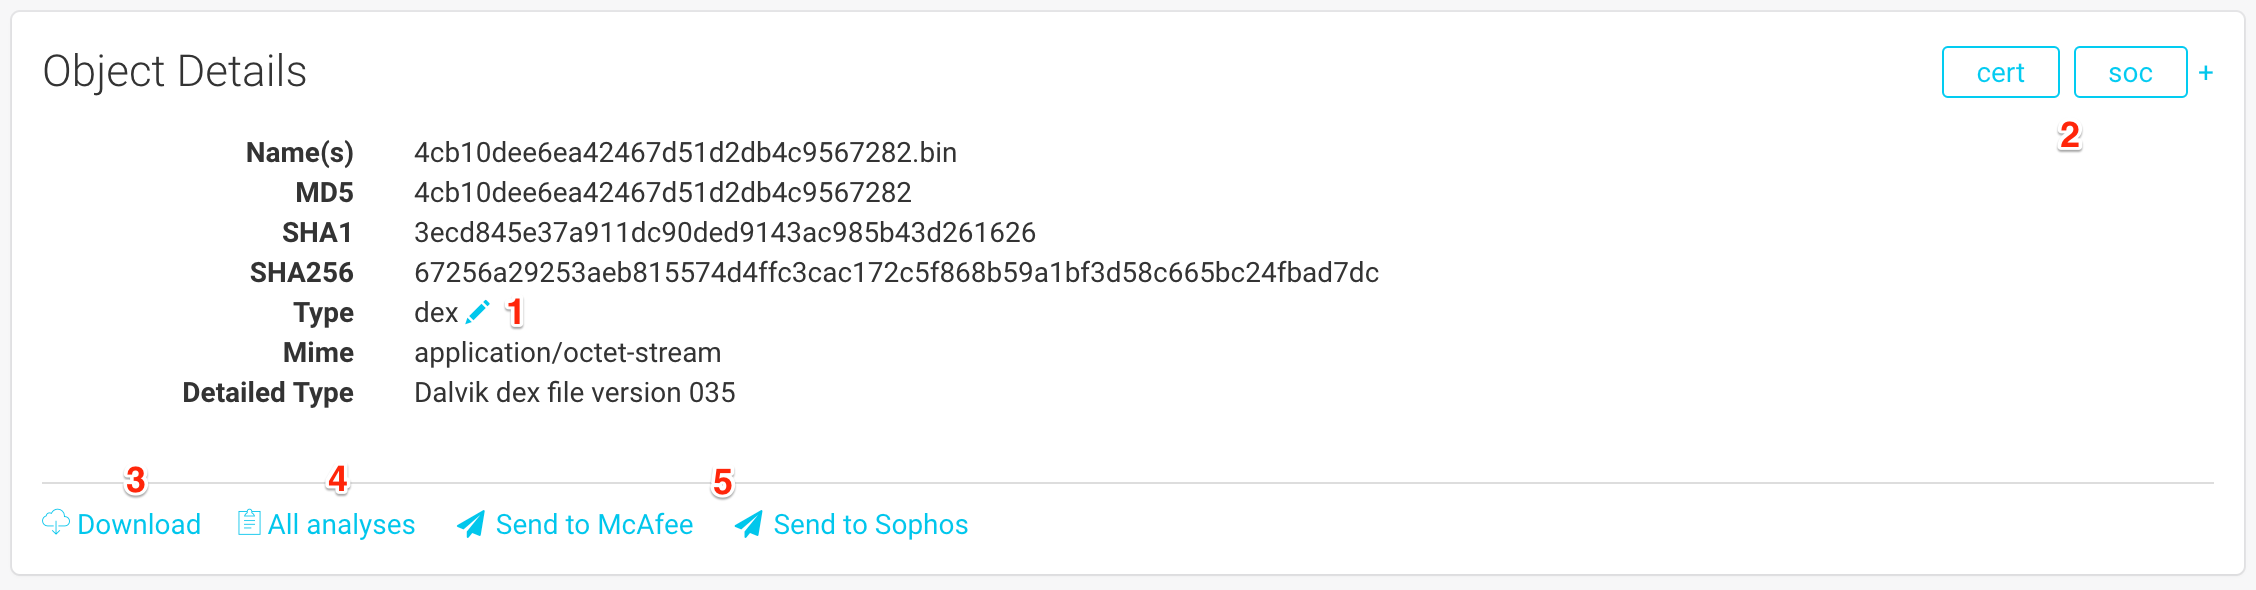
The file names that were used when the file was submitted.
Hashes of the file (MD5, SHA1 and SHA256).
The type that was determined by FAME
(1). This information is very important, since it determines which modules are available. You can manually change the type of the file by clicking on the pencil.The groups that have access to this object
(2). You can add a group by clicking on the+and remove one by hovering on the group of your choice and clicking on thex.You can download the file by clicking on
(3).The All analyses button
(4)will take you to the object’s page, and allow you to launch a new analysis on this object.You can submit the file to vendors by using the last buttons
(5). There is one button for each enabled antivirus module.
Execution Path
The second block is the execution path. It is used to display the status of the analysis:
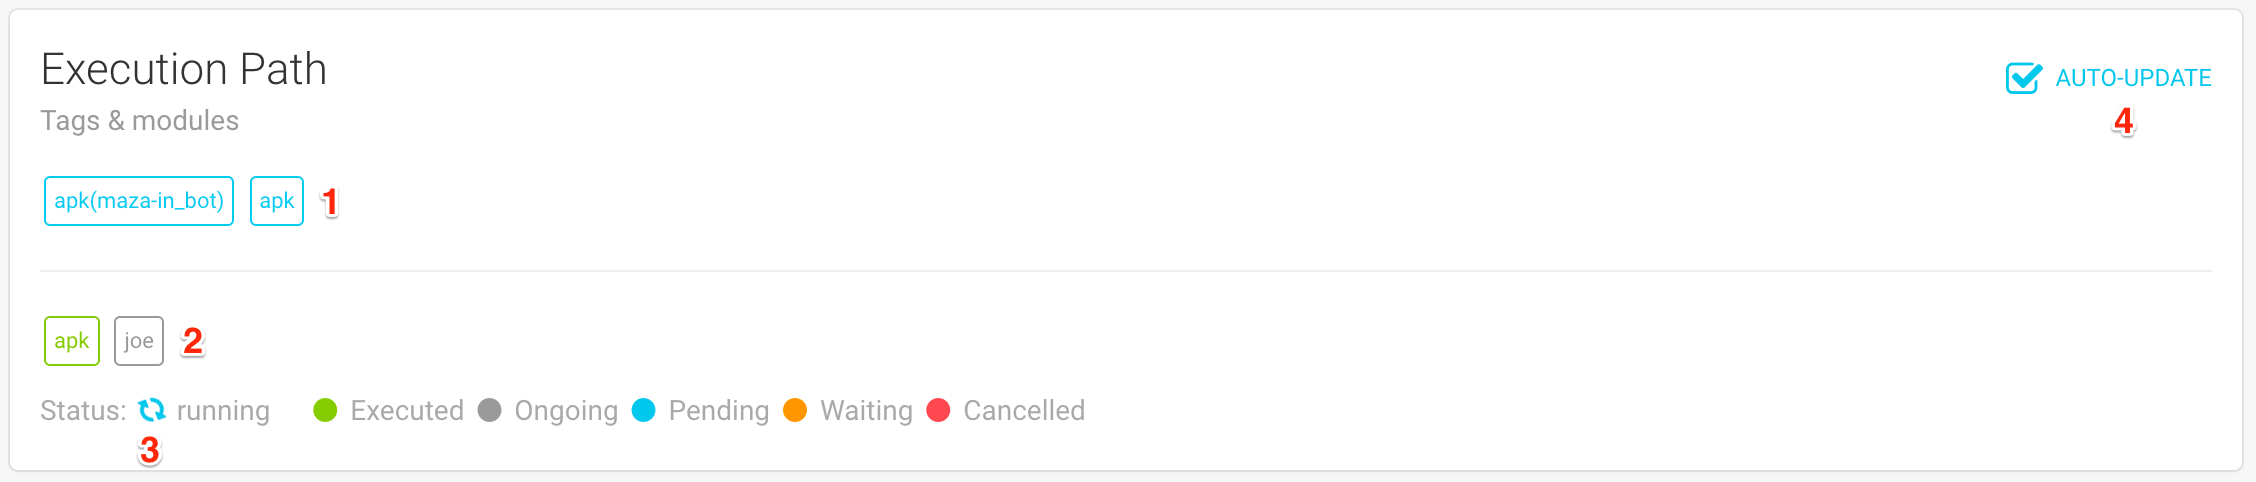
The first element displayed (1) (above the bar) is the list of tags that were added to this analysis. Tags can be seen as signatures that are meant to be easily consumed by machines. Tags are used by FAME to determine what additional modules should be triggered.
Below the bar (2), you can see the list of modules that were or will be executed during this analysis. Modules will have a different color depending on their state:
Executed (in green) when all processing is already over.
Ongoing (in grey) when currently running in a worker.
Pending (in blue) when waiting for a worker to be available.
Waiting (in orange) when a module was triggered, but cannot be directly executed. For example, a module that acts on a memory dump needs to wait for one to be generated by another module.
Cancelled (in red) when FAME was not able to meet requirements for the execution of a module. In the example described previously, a waiting module would change to cancelled if FAME was not able to generate a memory dump.
The global status of the analysis is also displayed (3). The status can be:
Pending: when all queued modules are still pending
Running: when at least one module was executed or is ongoing
Finished: when all modules were executed or cancelled
Error: when FAME was not able to execute a single module
When the status of the analysis is pending or running, the page will automatically update itself, every ~3/5 seconds. This is designed so that you can have access to a module’s result as soon as they are available. However, this can sometimes get in the way, for example when trying to copy information from the results. If you want to disable auto-update, you can uncheck the box at the top-right corner (4).
Observables
This block will group all observables that were extracted by modules. This will typically list IP addresses, URLs and domain names but can also list email addresses, filenames, etc.
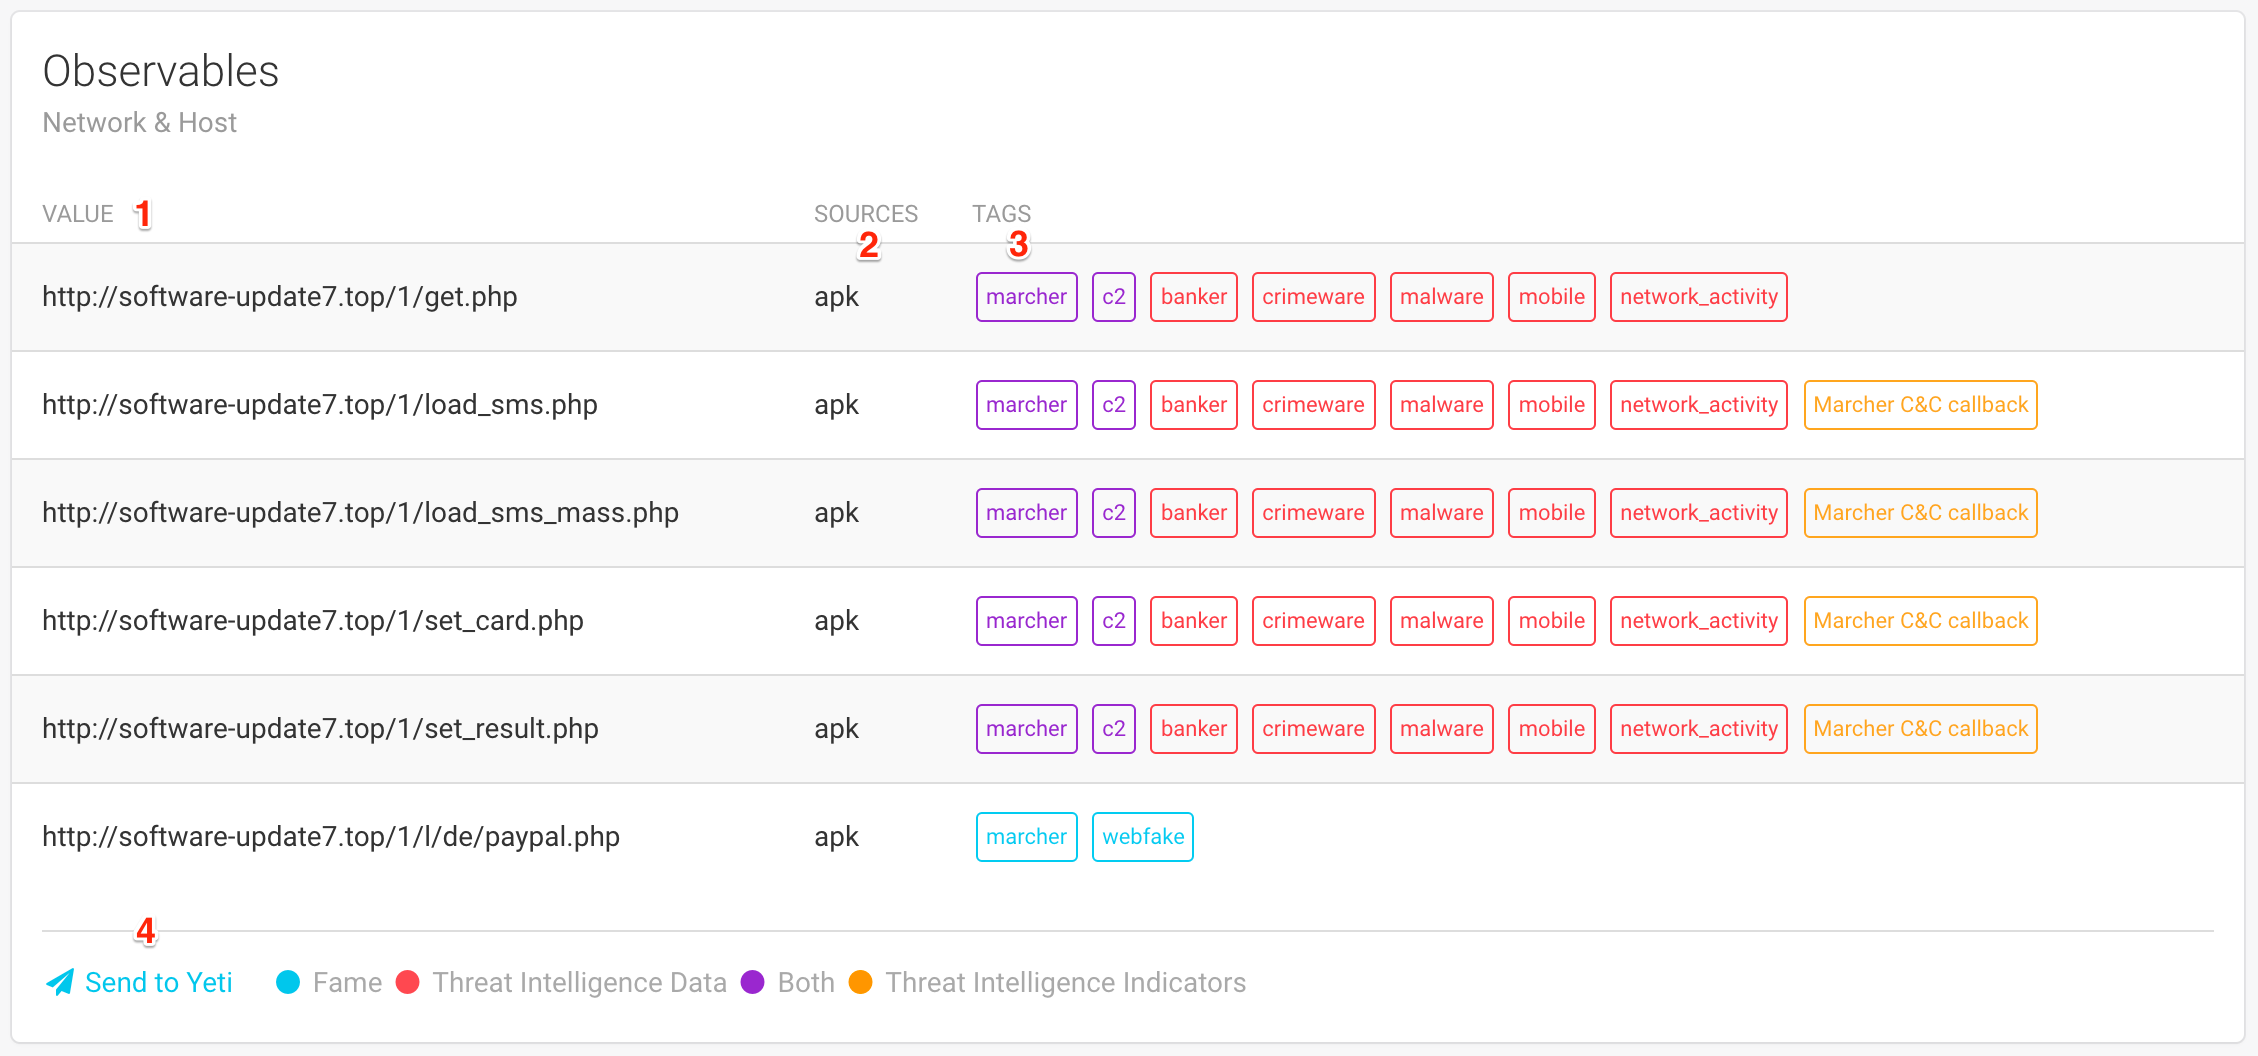
For every observable, you will see:
The value of the observable
(1).The sources
(2)which is a list of modules that added this observable.A list of tags
(3)associated with this observable. Tags can have different meaning, indicated by colors:In blue, these are tags that were added by one of FAME’s modules. In this example, the module that extracted Marcher’s configuration was able to determine that the last URL was a webfake used by marcher.
In red are tags that come from Threat Intelligence data. Every time an observable is added, it is submitted to all threat intelligence modules in order to determine if it is already known. When it is known, associated tags are displayed in red.
In purple are tags that meet both conditions previously described: they were determined by FAME AND were already associated with this observable in threat intelligence data.
In orange are threat intelligence indicators. This means that the threat intelligence platform was able to recognize a pattern, even if it does not necessarily knows this particular observable. Hovering on an indicator tag might reveal more information on this indicator.
Note
The process of adding tags from threat intelligence modules is performed when the observable is added to the analysis ant not when the analysis results are displayed. Your threat intelligence might have changed since.
If you have the necessary permission (submit_iocs), you will also have the opportunity of adding these observables to your threat intelligence platforms directly from FAME. At the bottom, you will see one button per enabled threat intelligence module (4). When clicking on this button, the list of observables will change to reveal a form:
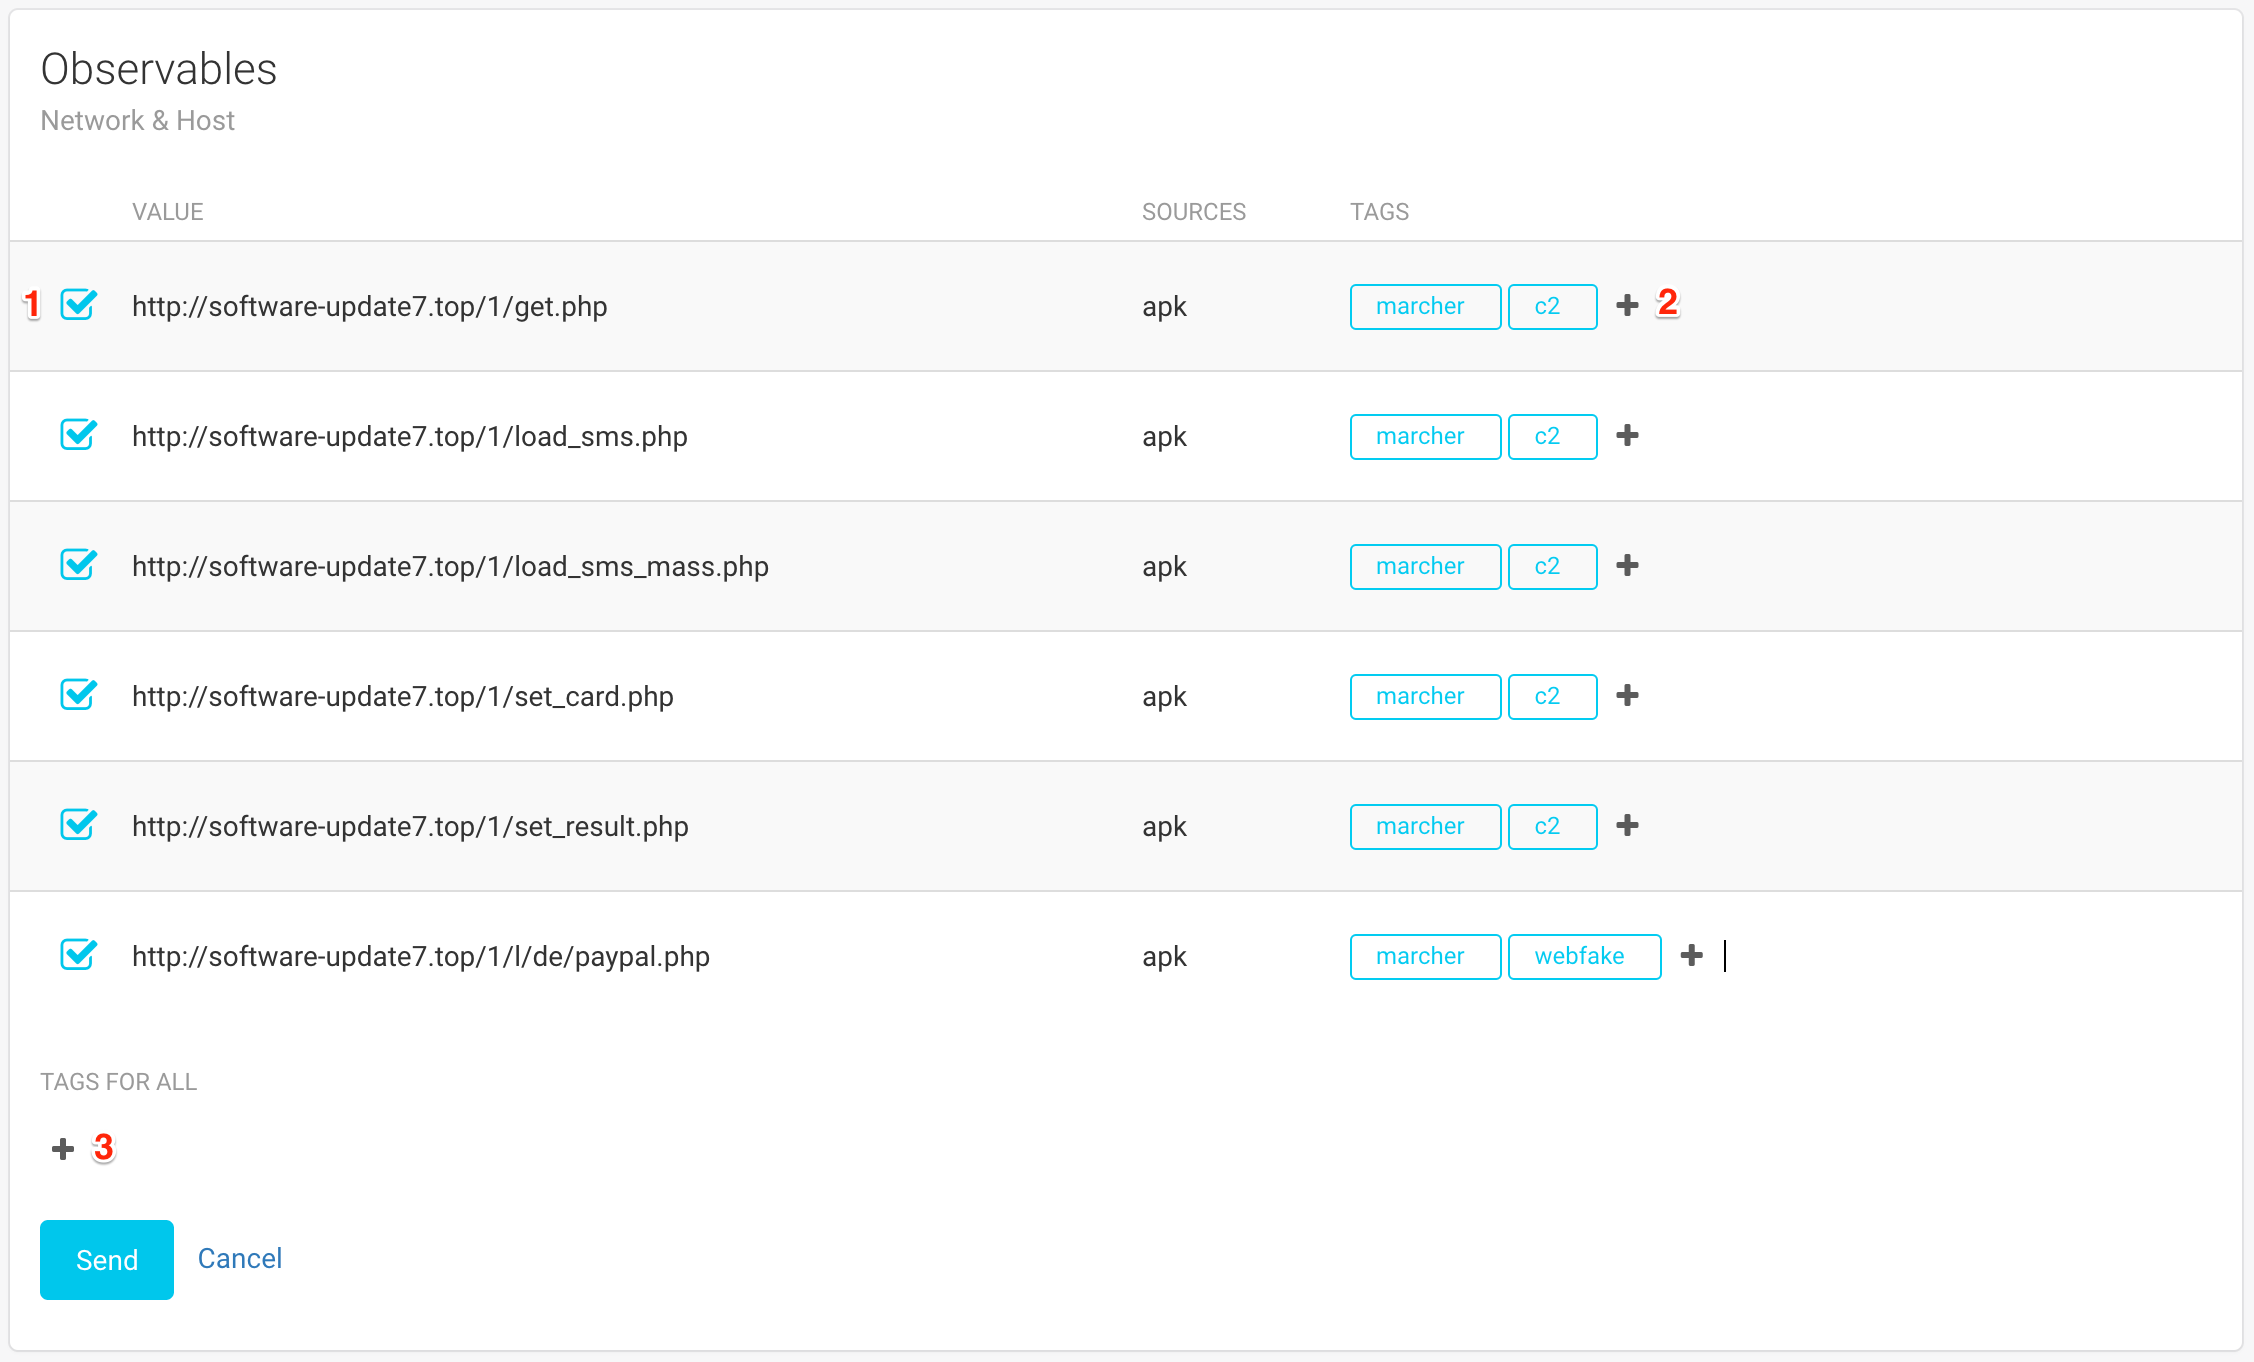
Each observable is preceded by a checkbox (1) that determines if the observable will be added to the threat intelligence platform or not. Observables that were tagged by FAME will automatically be pre-selected.
On each line, you can specify the tags that you would like to associate with each observable (2). Once again, the tags that were determined by FAME are already added, to make your job easier. When you want all observables to have identical tags, you can use the Tags for all field at the bottom (3).
When you are finished selecting your observables and defining tags, click on Send.
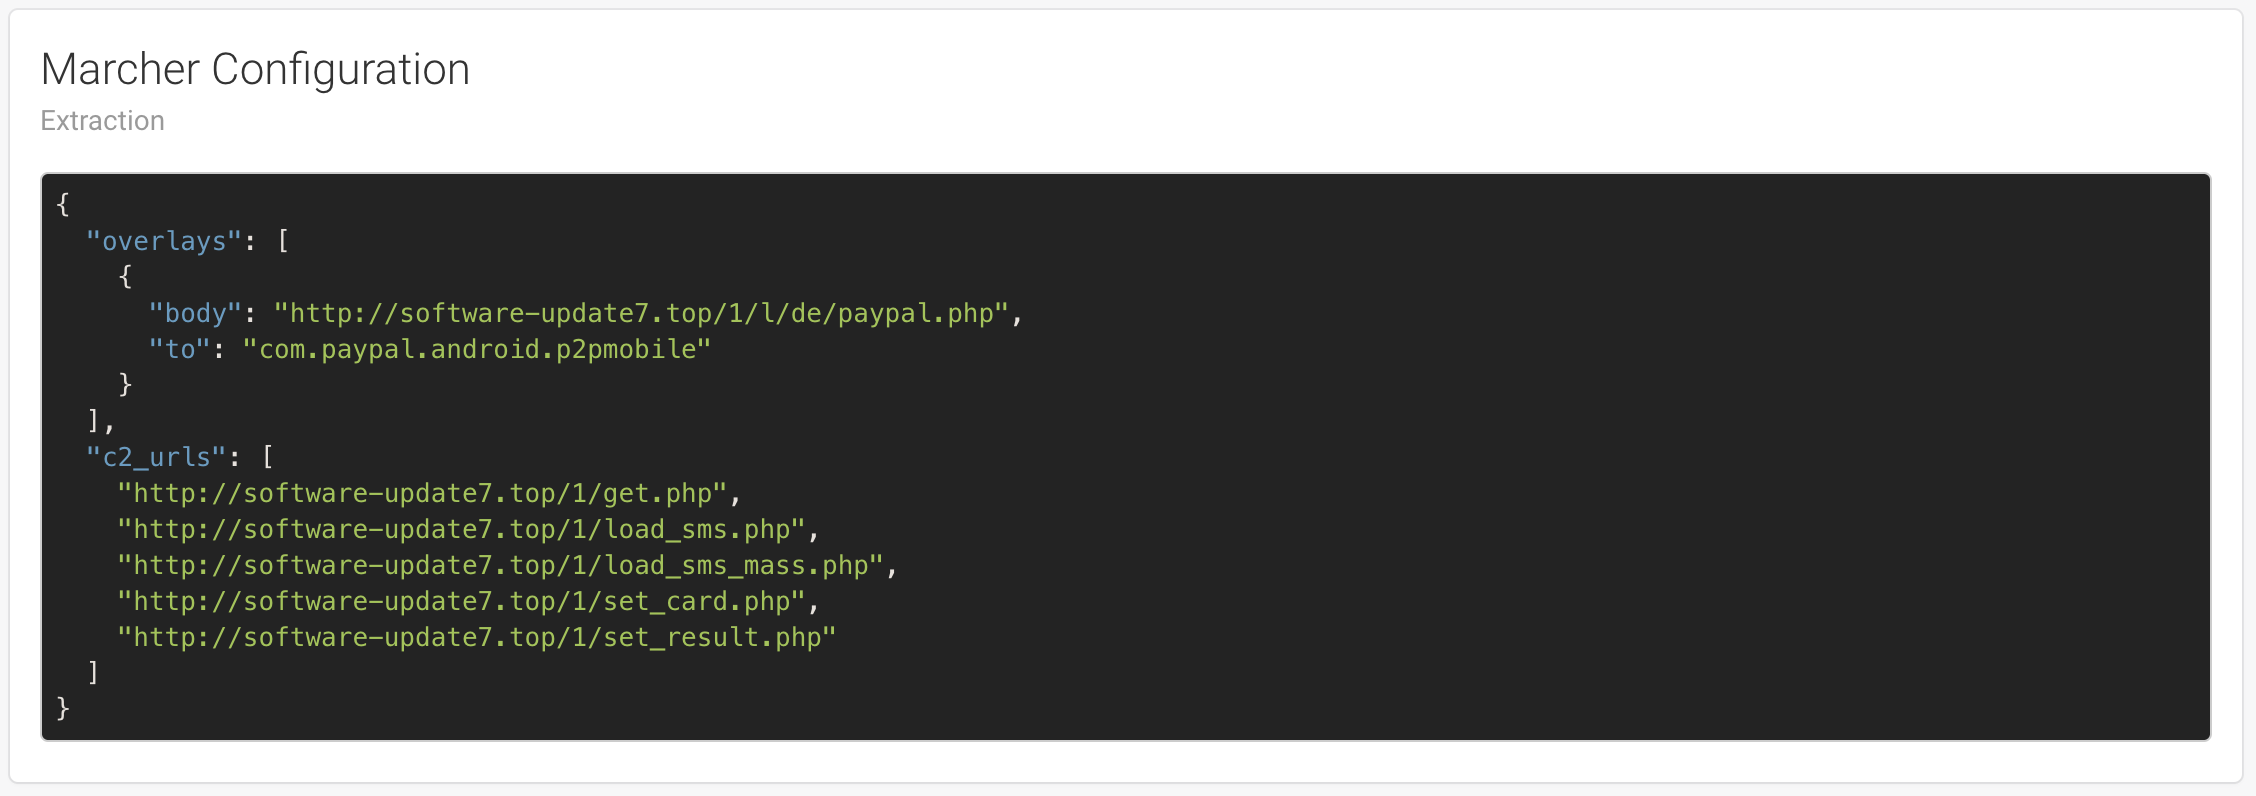
Extractions
Extractions are blocks of text that are displayed right after the observables because they might be of high interest for the analyst. This is typically used when a module was able to extract a malware’s configuration.
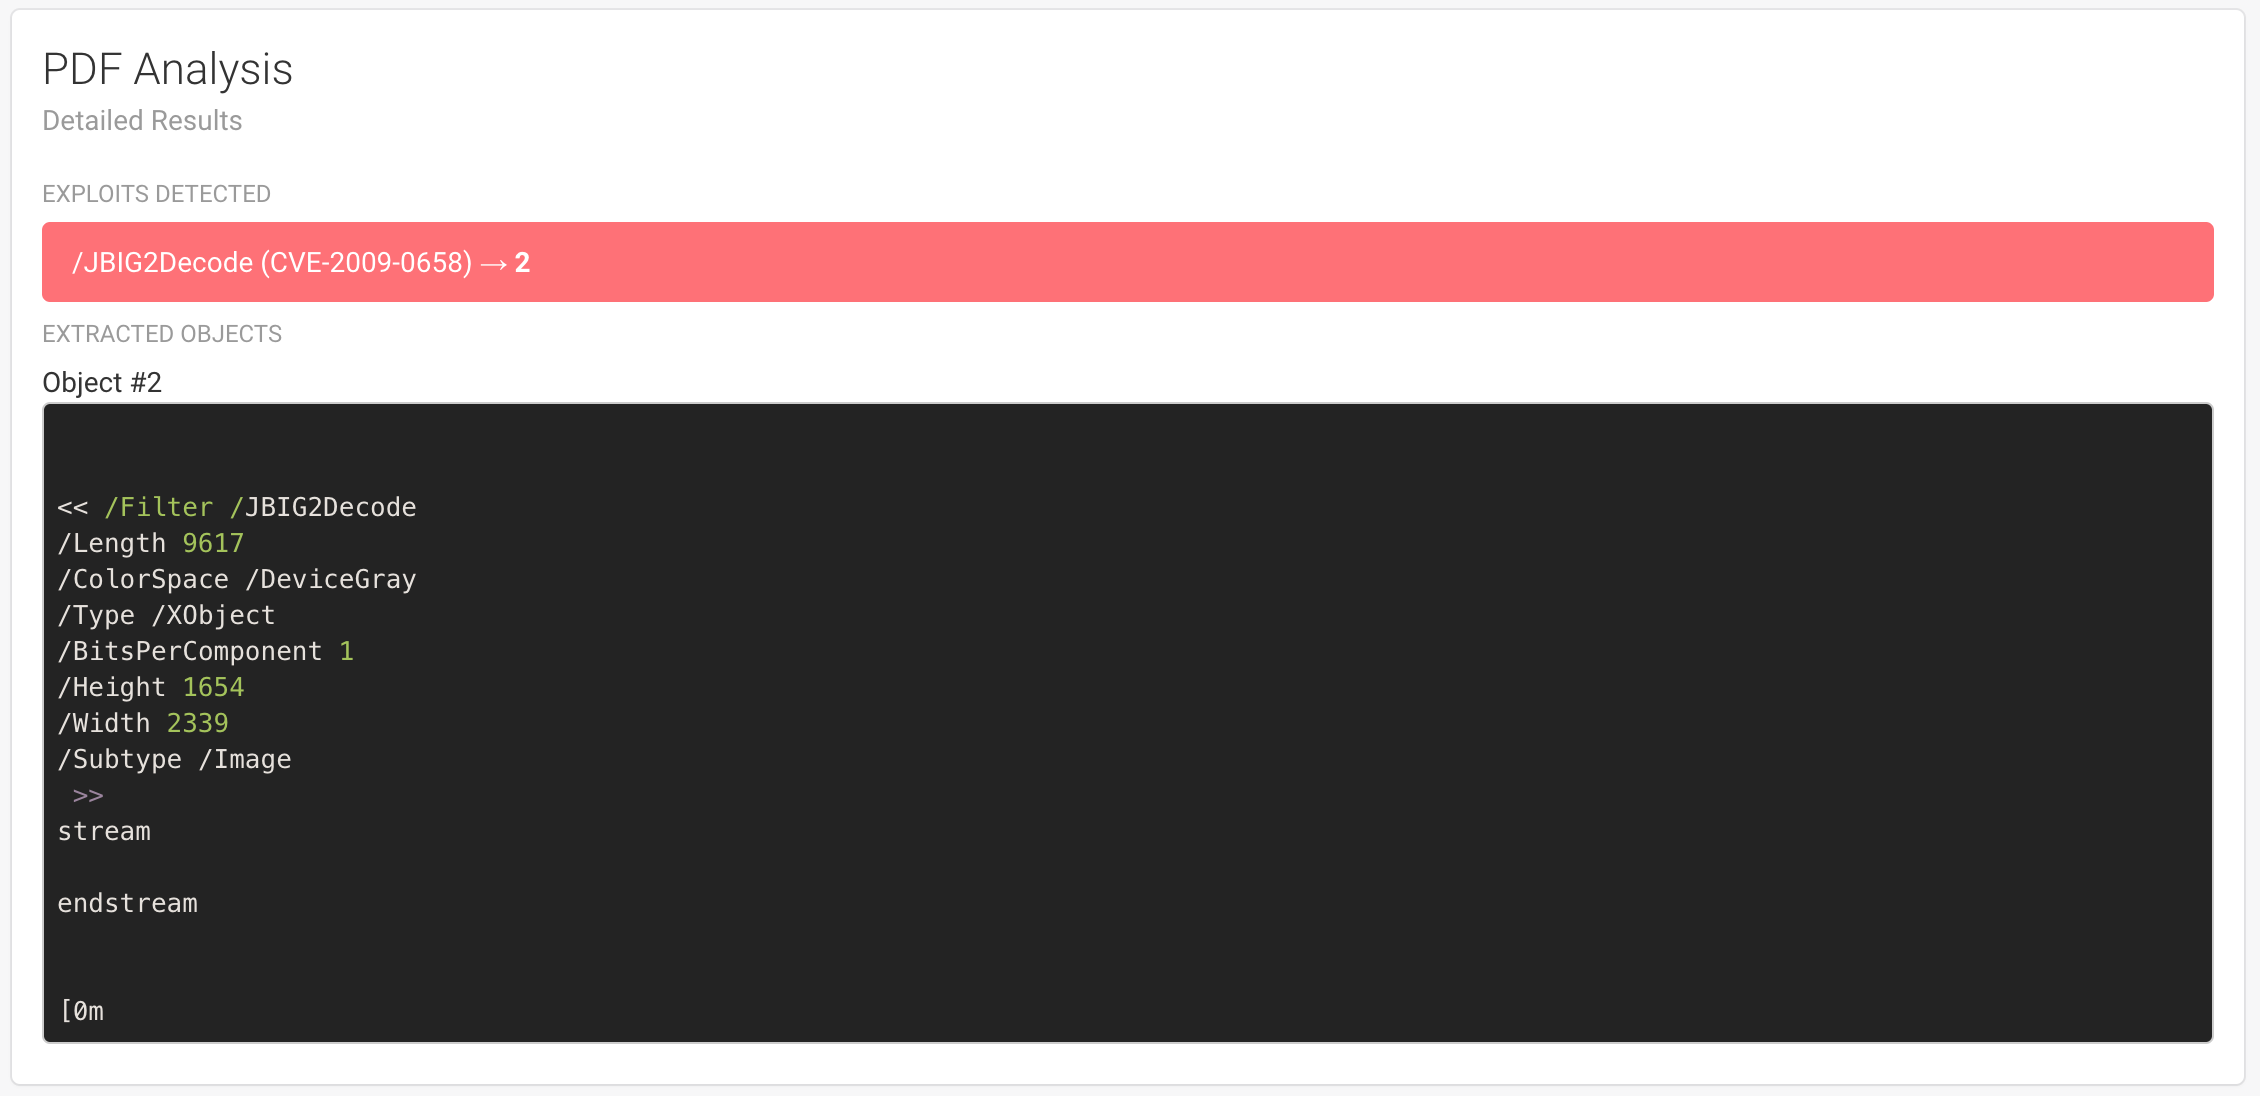
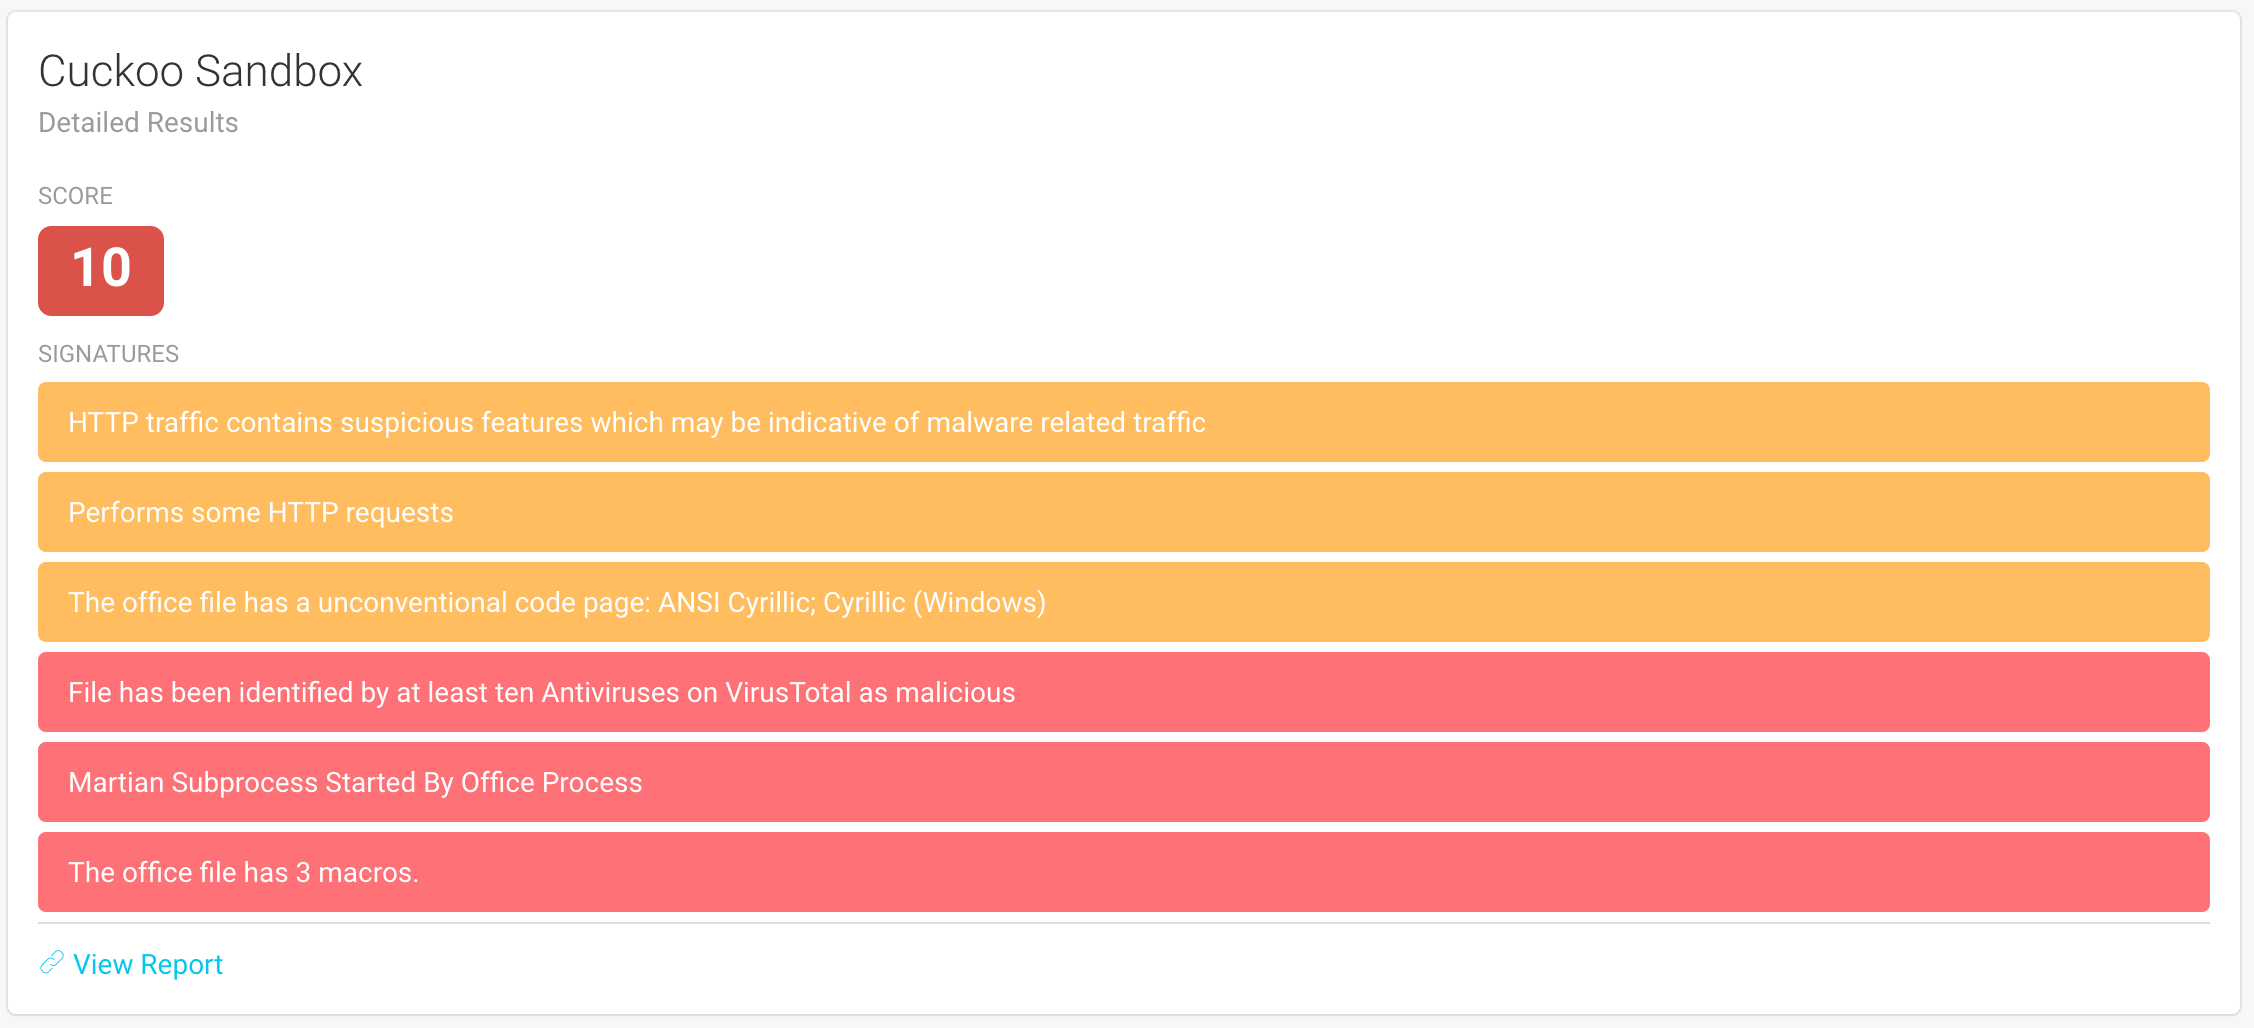
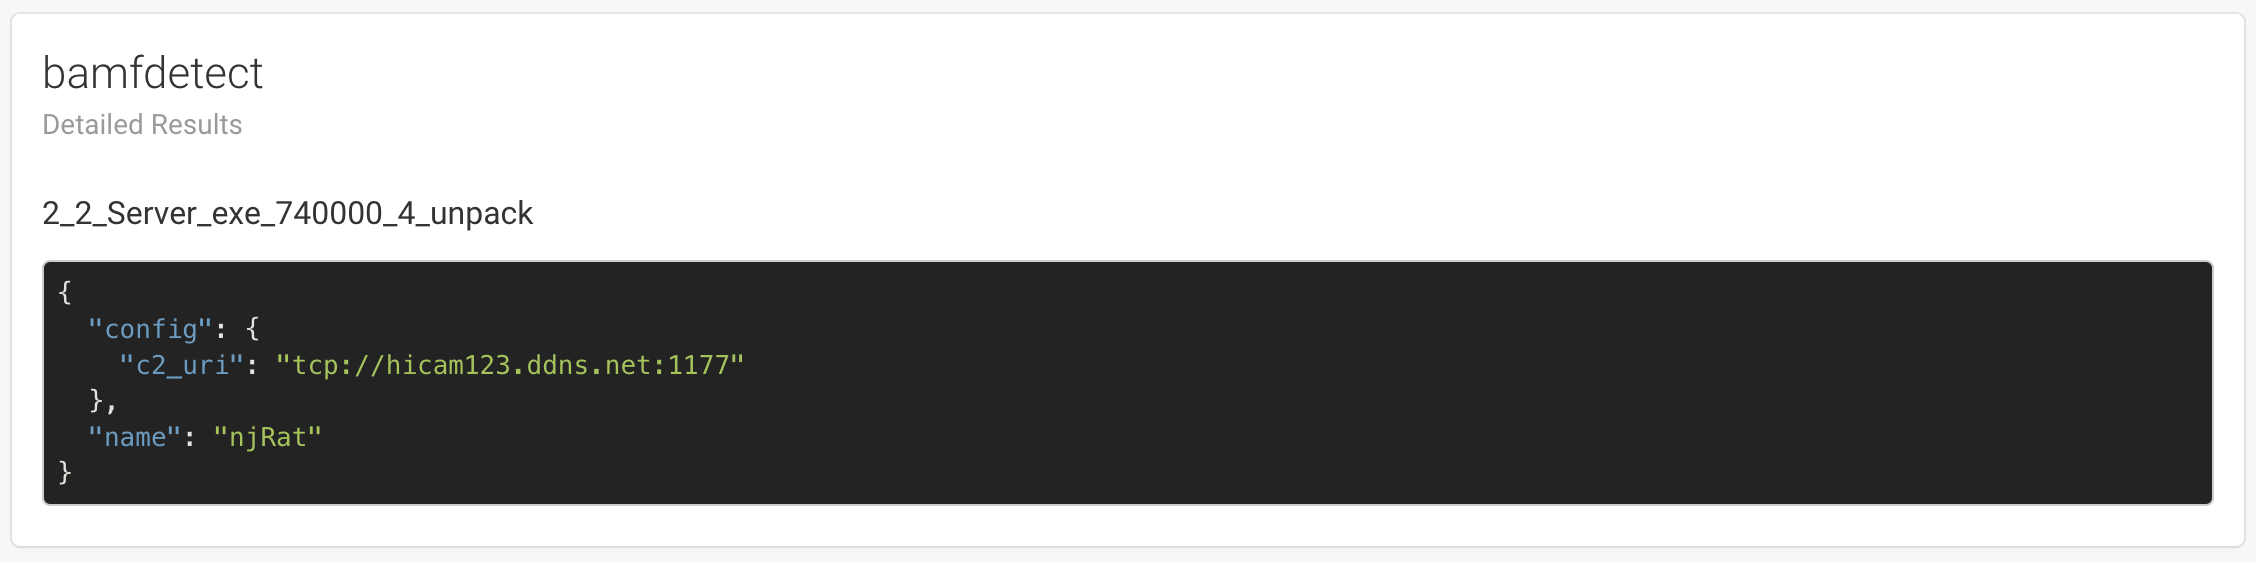
Detailed Results
Each module has the possibility to display detailed results and may use a different template.
Logs
If you have the needed permission (see_logs), you will have access to the analysis logs, which can be used to have more information about the analysis and be used to debug issues with certain modules.
Warning
Logs can reveal information about your infrastructure, such as local file paths or executed commands.
Objects
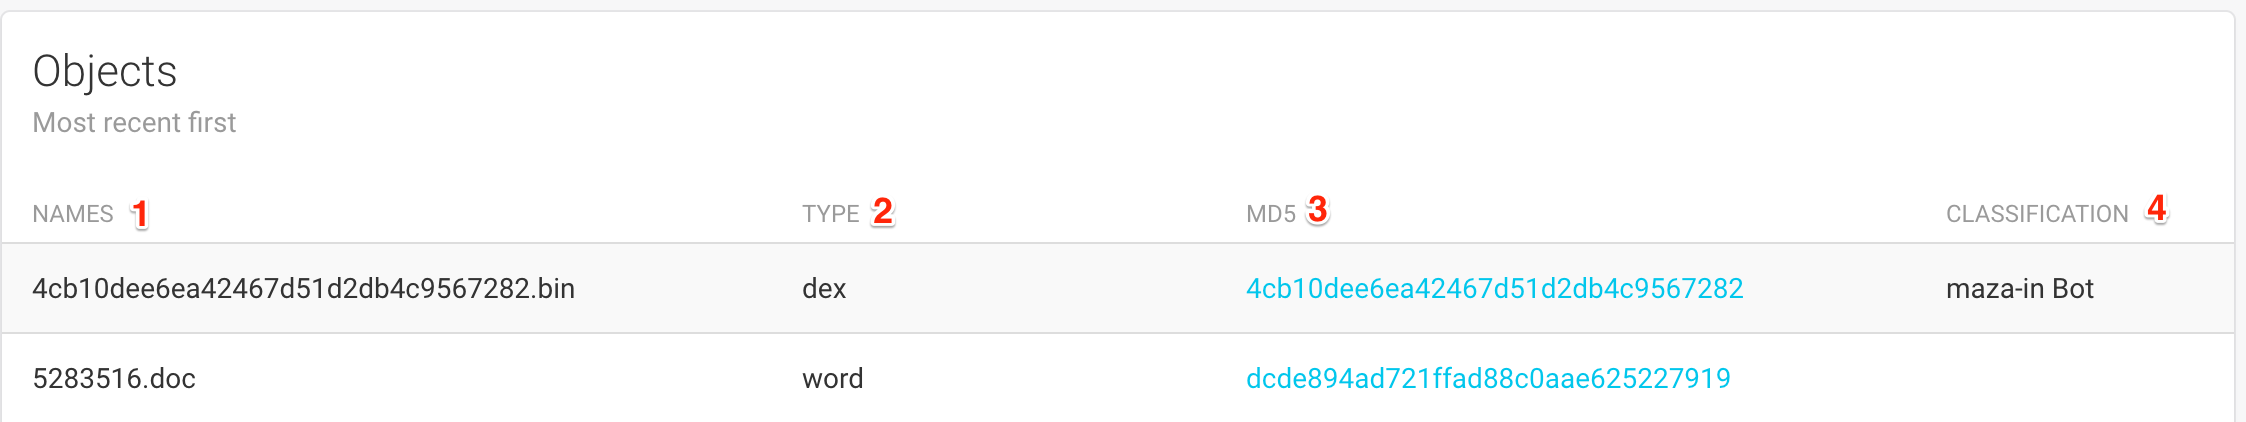
The list of objects displays the following pieces of informations:
This list of file names associated with this object
(1).The type that was determined by FAME for this object
(2).The MD5 of the object
(3). Clicking on the MD5 will take you to the Object Page.All probable names that are associated with this object
(4).
Object Page
Additionally to the Object Details, this page lists all analyses that were already created for this object:
This list is similar to the one on the Analyses page and provide links to each analysis’ results.
The main interest of this page is the possibility to launch a new analysis on an existing object, by using the form available in the sidebar:
This form is similar to the one on the Submission Page.
Configuration Tracking
Note
You need the configs permission in order to access this section.
This section allows you to track the different botnets that are targeting your monitoring perimeter, provided you have modules that are able to parse these malware families’ configurations.
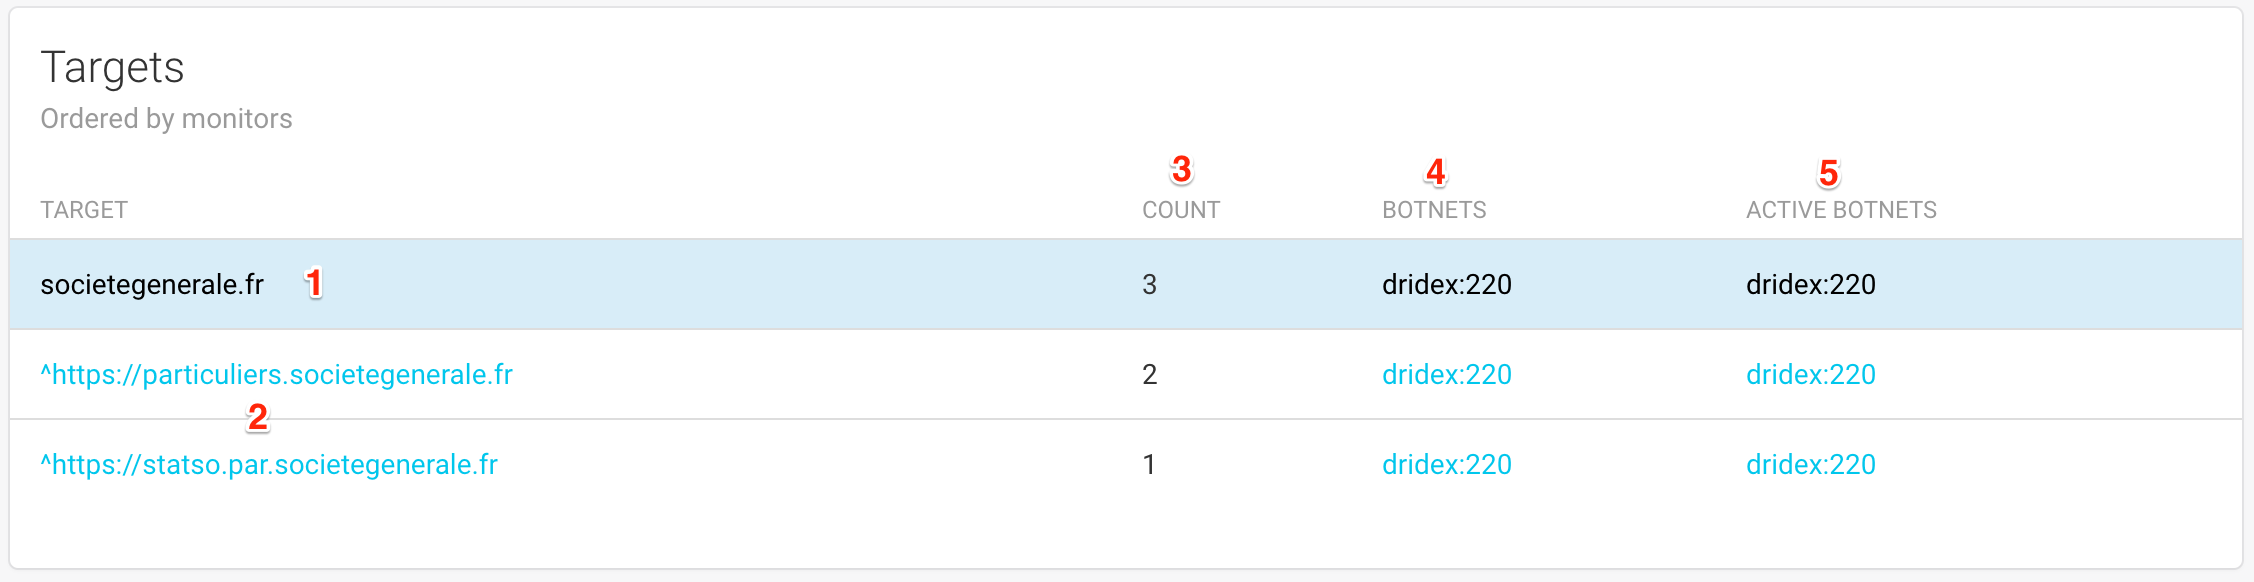
This table is listing the targets (2) extracted from malware configurations, sorted by monitor. A monitor (the blue lines (1)) is simply a string that will be searched for in configurations extracted by FAME.
For each monitor, or target, the table will list:
The number of configuration blocks found for this target
(3)The list of botnets that once included this specific target in their configuration
(4)The list of botnets that are currently including this specific target in their configuration
Clicking on a monitor, a target or a botnet name will open the Configuration Timeline filtered accordingly.
Configuration Timeline
This page is displaying all configuration blocks matching a set of filters by chronological order.
The first block (Global Actions) allows you to modify the timeline.
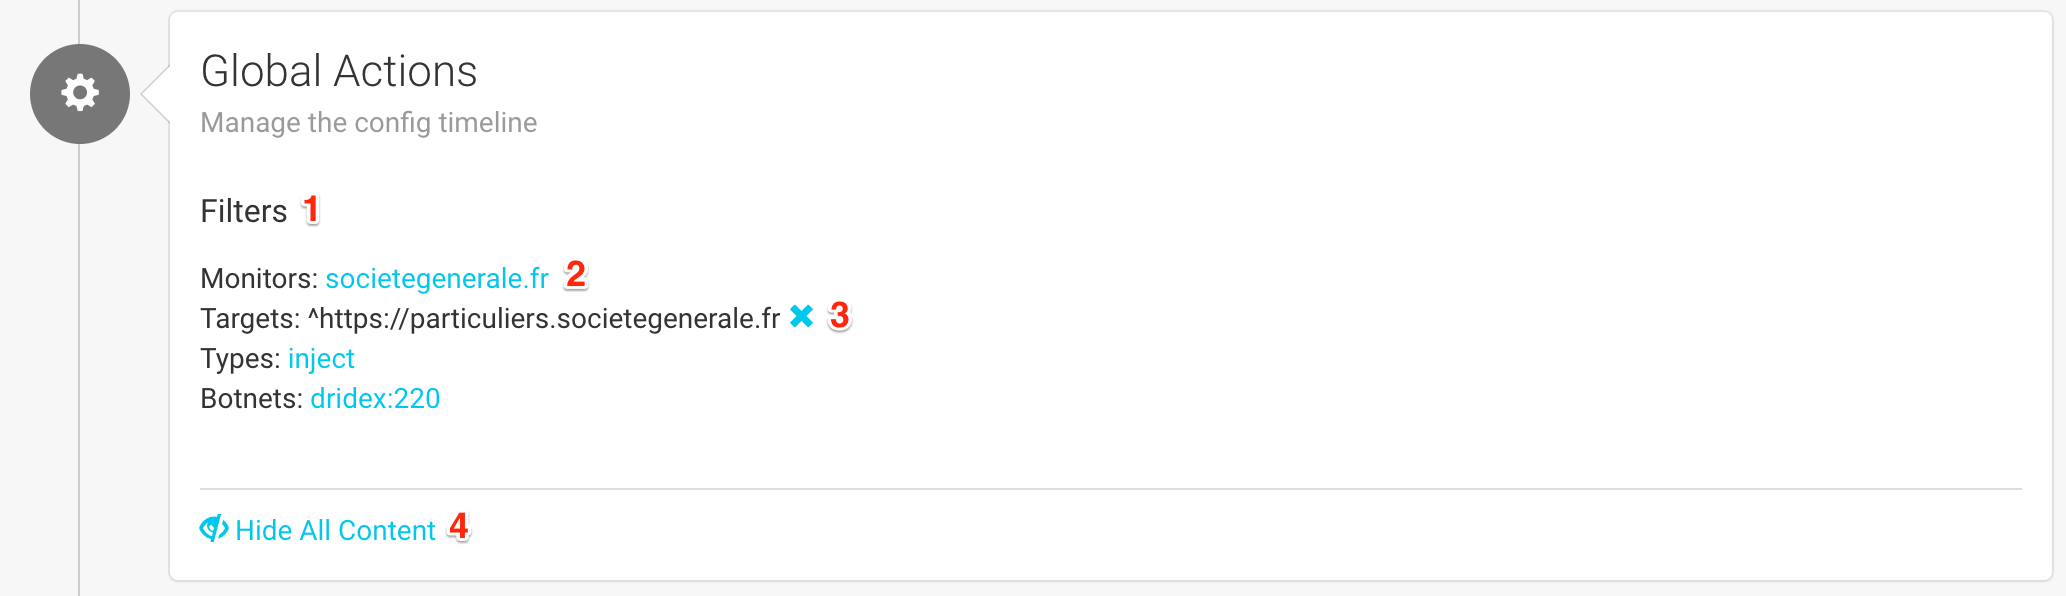
This is the place where you can change the filters applied to the current timeline (1). Currently applied filters are displayed in black (3) and can be disabled by clicking on the blue cross next to it.
Available filters appear as links (2) that you can click to apply.
Finally, you can show or hide content for all configuration blocks (4) in order to display more or less details.
Each configuration block is then individually displayed, with the following information:
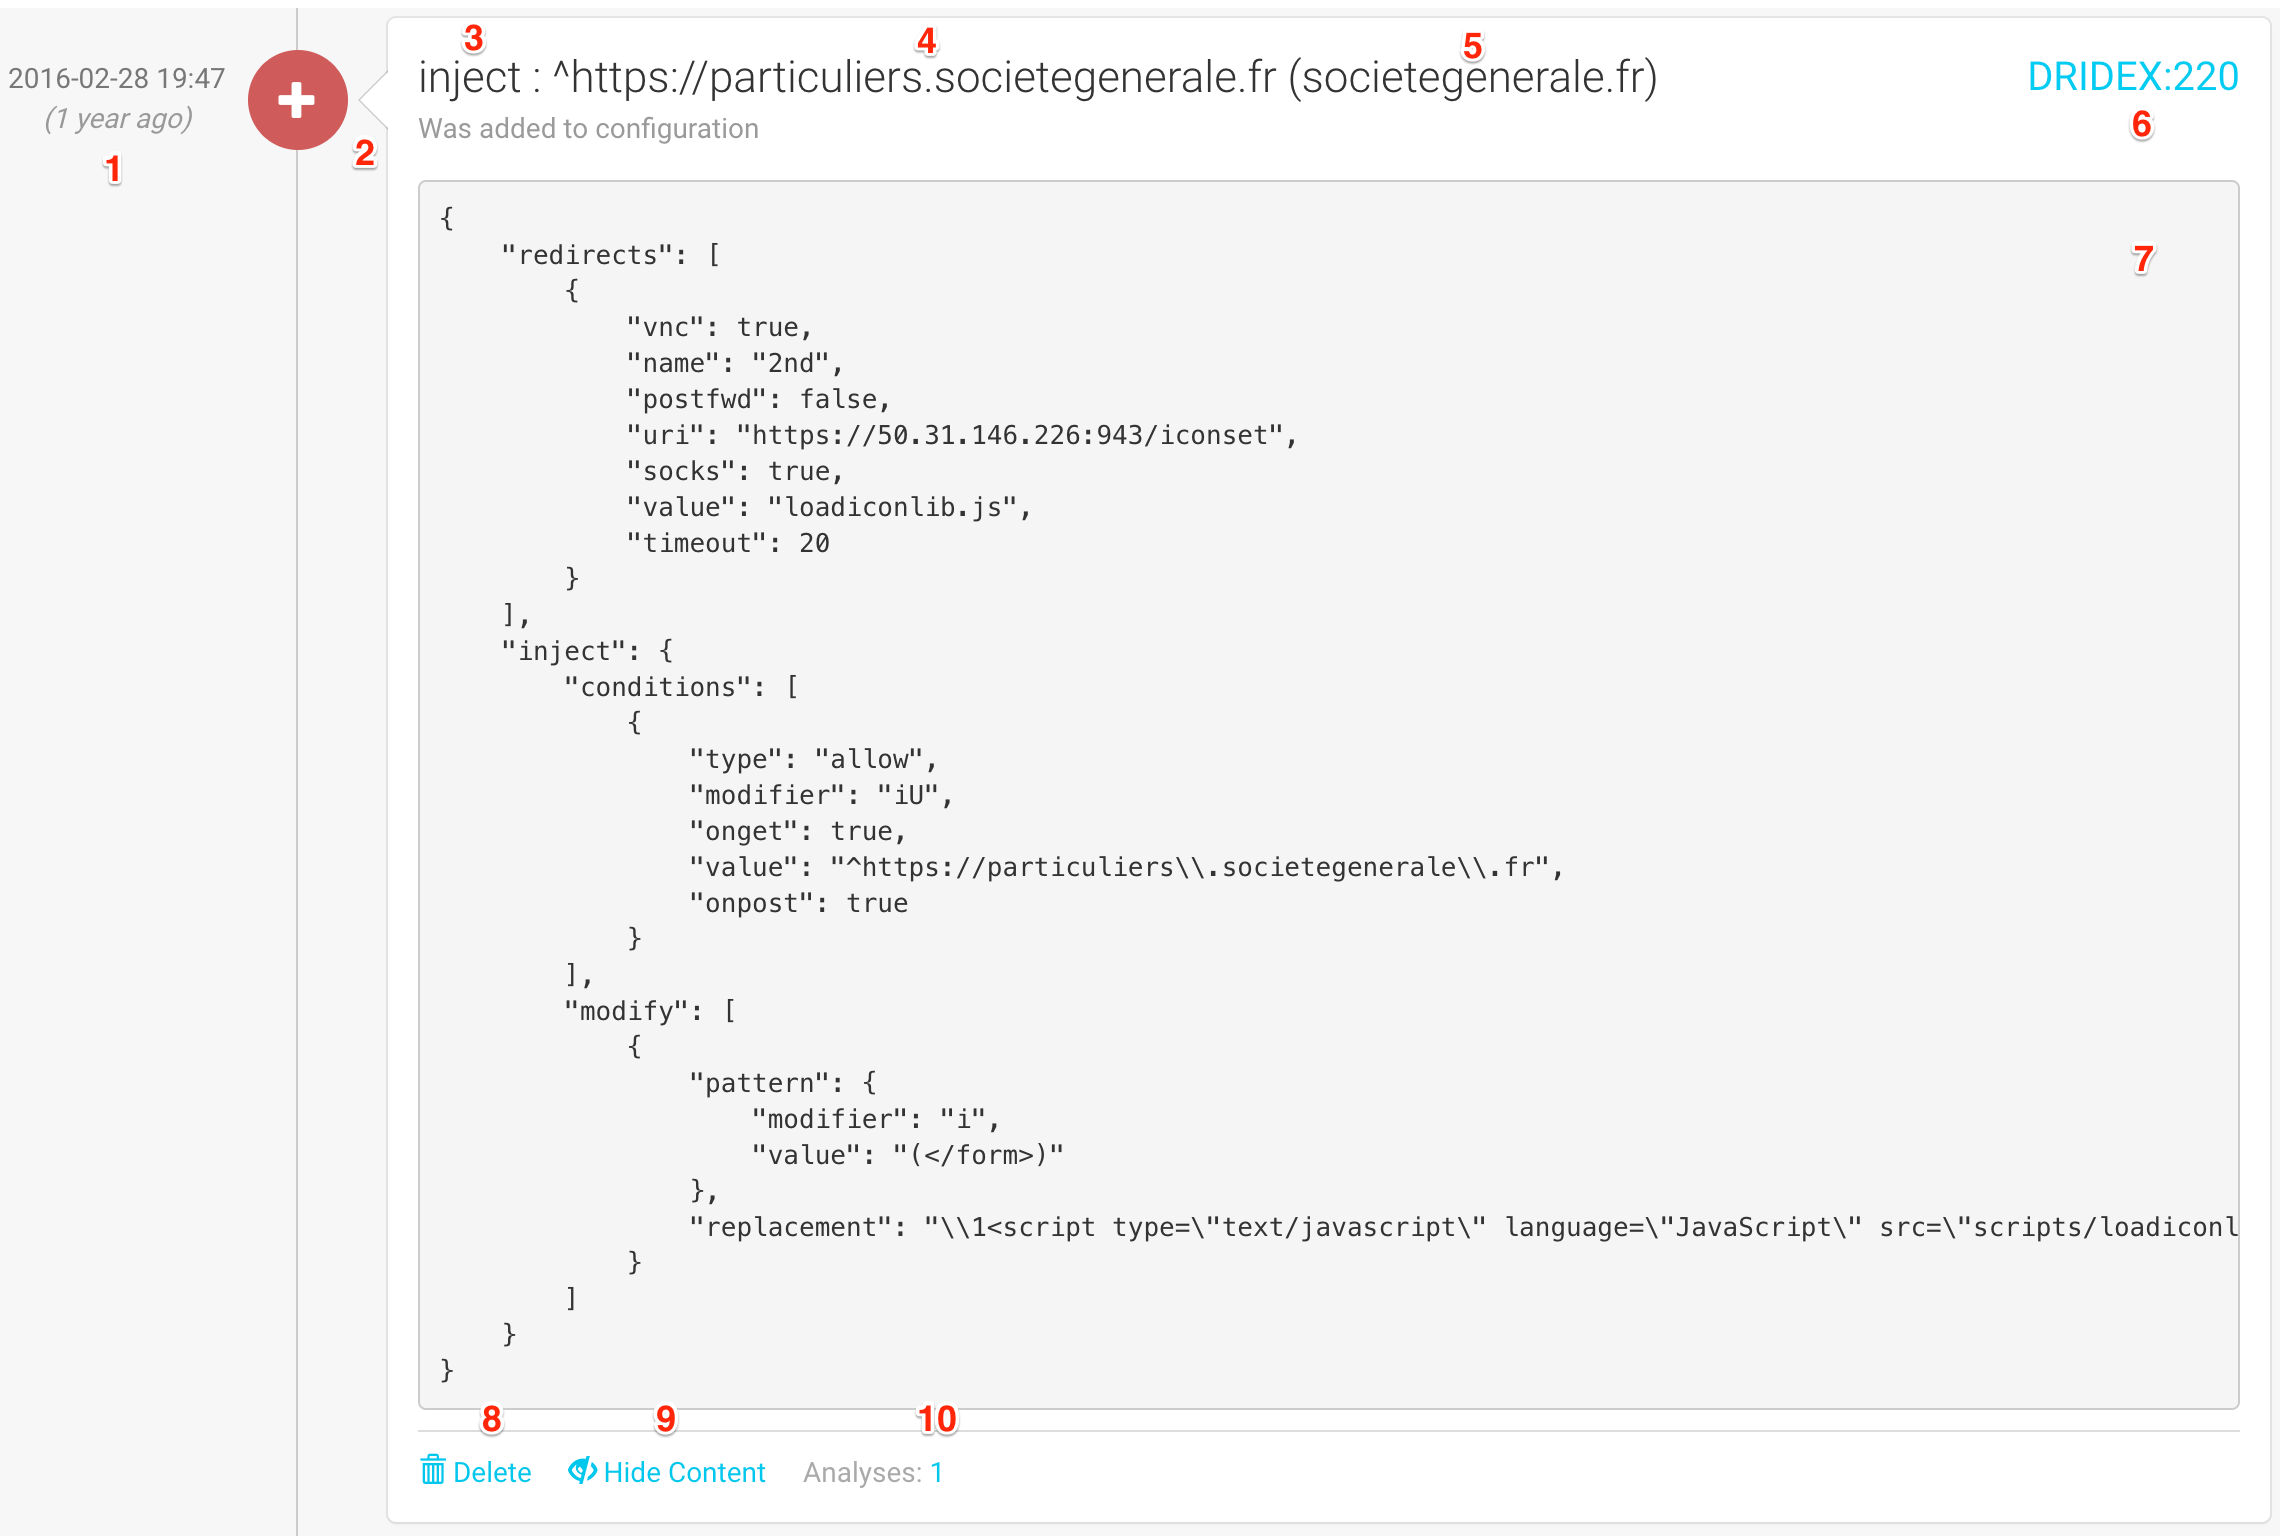
The date at which this configuration block was created
(1)An icon showing which kind of configuration block this is:
(2)* An new block: this target was not in the configuration before * A modification: this target was already in the configuration, but the content changed. * A deletion: this target is no longer in the configurationThe type of configuration block
(3)that defines what will be done by the malware for this target (valid examples or: inject, screenshots, overlay, etc.)The target
(4)which is the string that is extracted from the malware configurationThe monitor: string that matched the target
(5)The name of the botnet
(6)(malware_family:botnet_id)The malware’s configuration for this target
(7)You can delete
(8)a configuration block, show its content or not(9)and access the analyses that extracted this configuration block
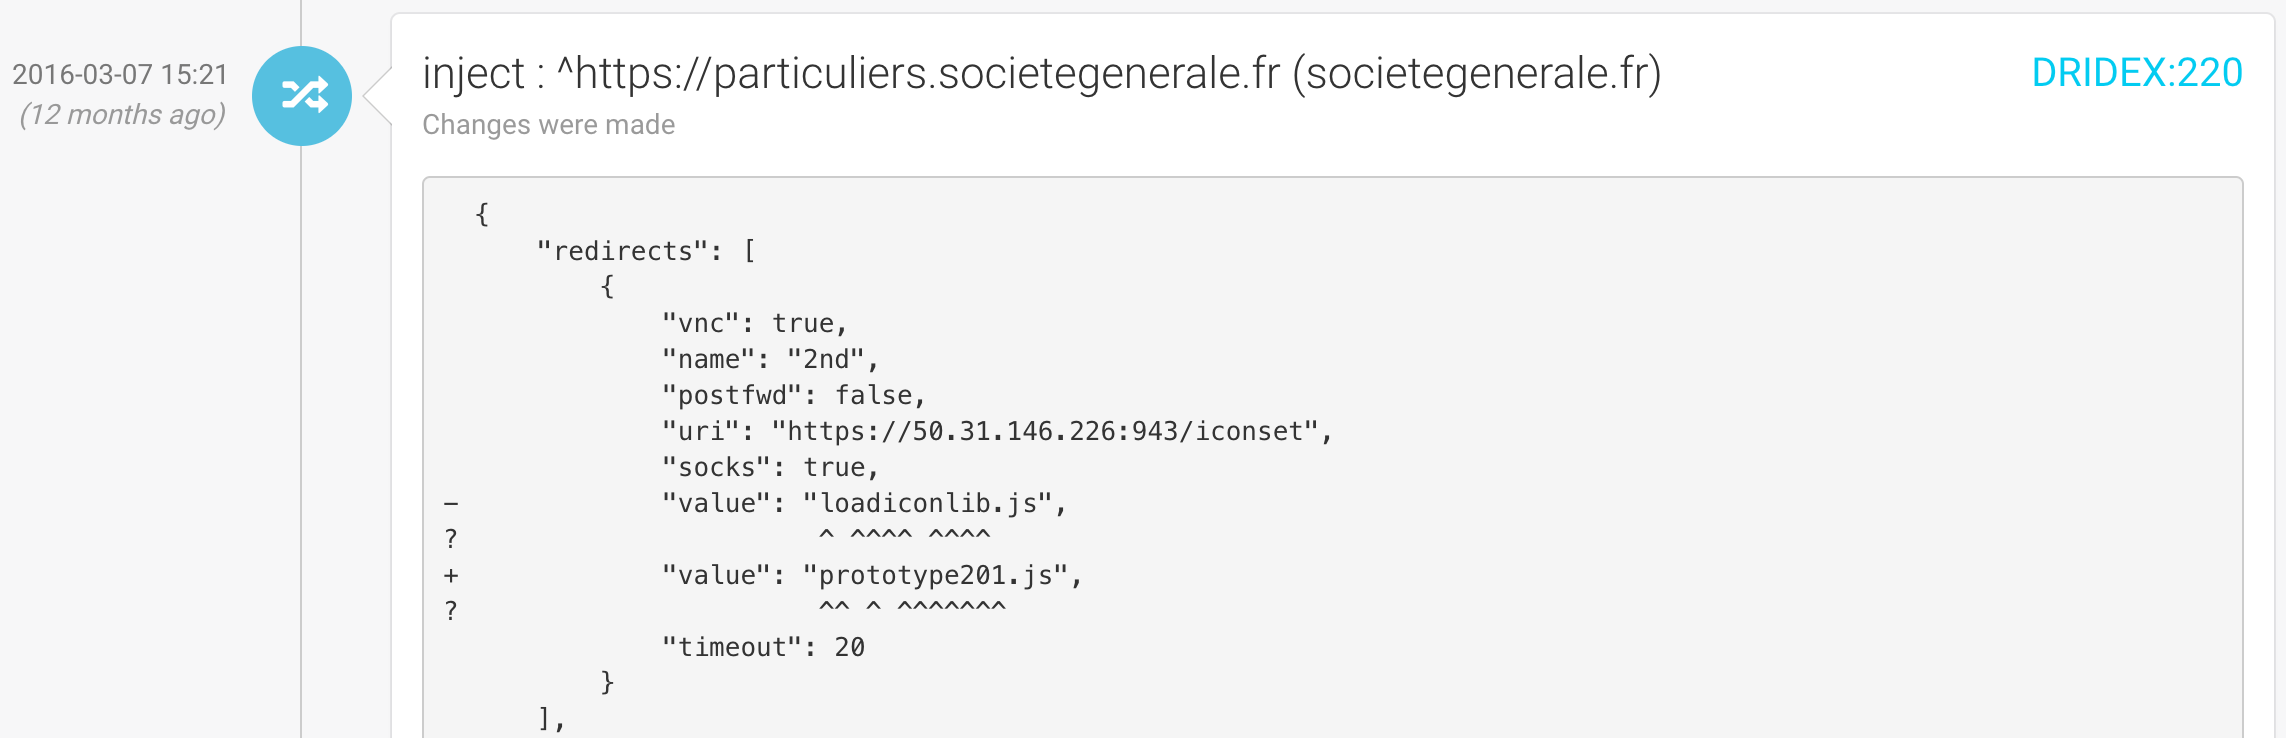
When the configuration block is a modification, it will display the full content as a diff with previous version:
User Profile
Clicking on your avatar on the top right corner will let you logout, or access your user account.
Your profile page has the following panels.
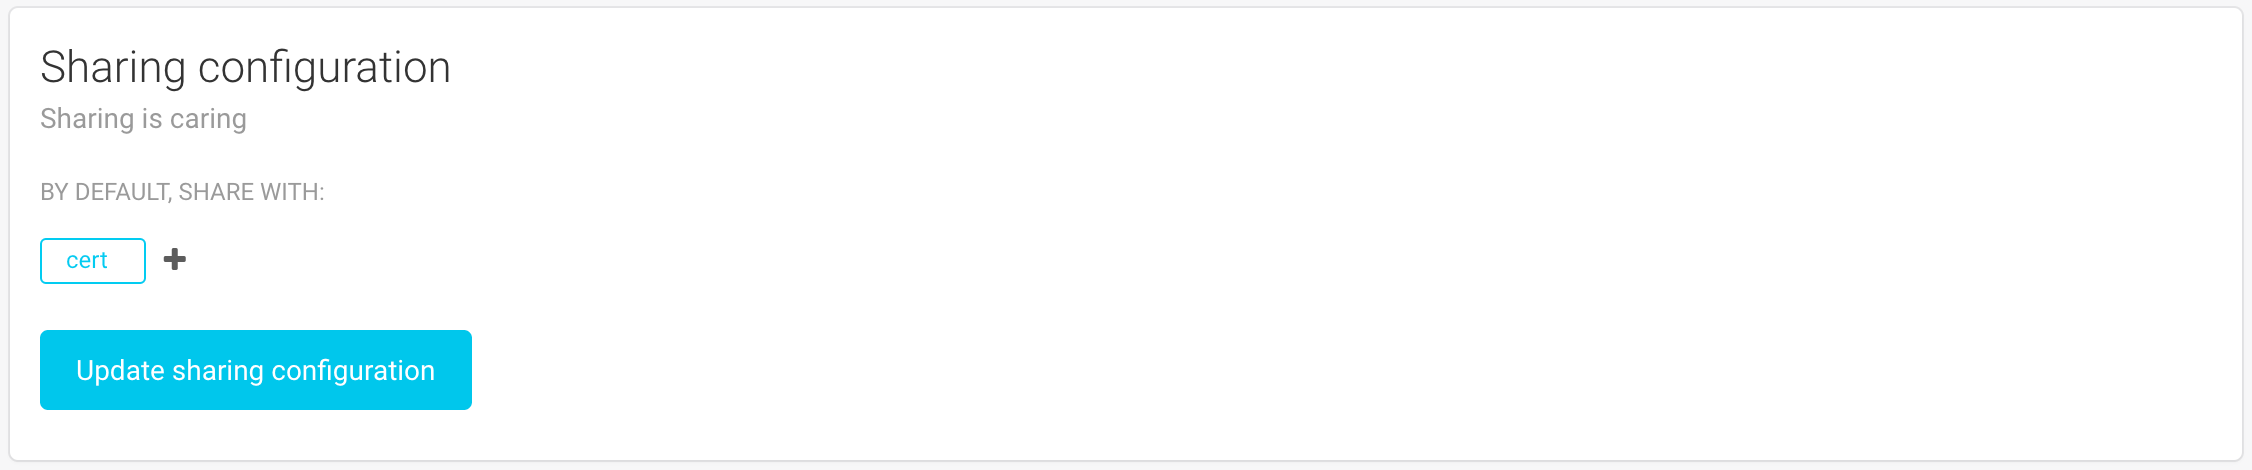
You can edit your sharing preferences. This setting will be used when creating an analysis, in order to pre-fill the sharing field. You can put any list of groups here, as long as the list contains at least one of your groups.
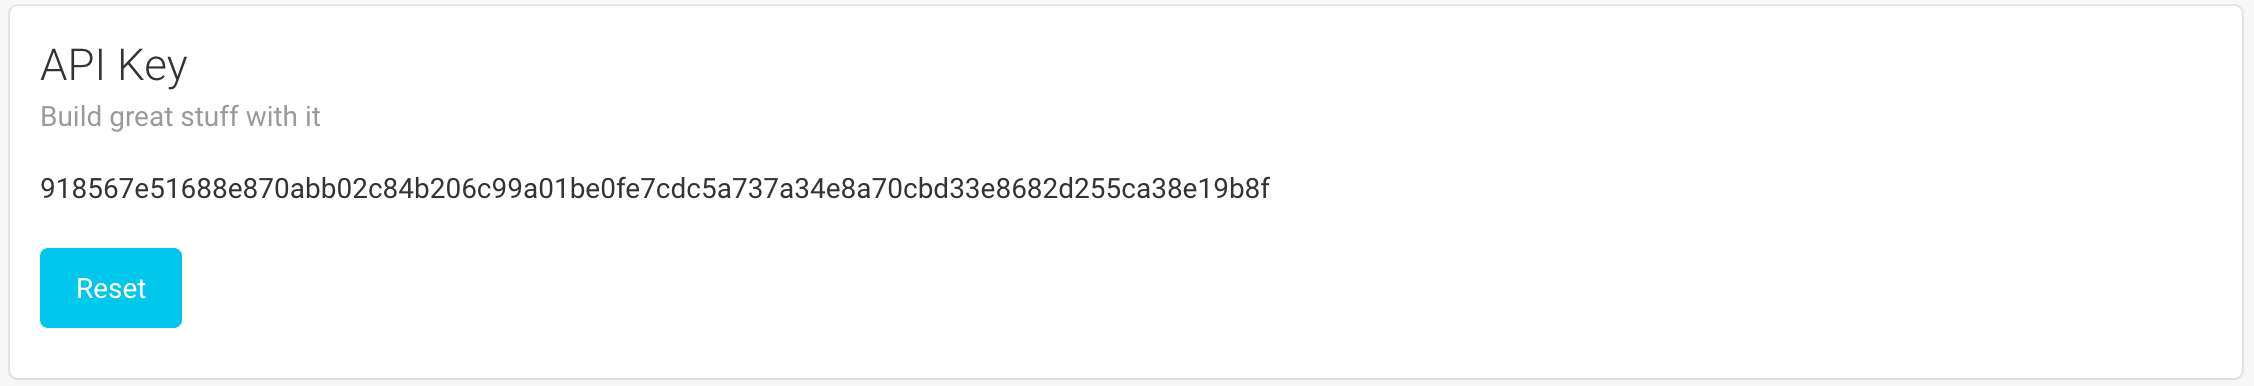
This panel enables you to get and reset your API key. If you need to automate some tasks, you will need this key to authenticate without using your password.
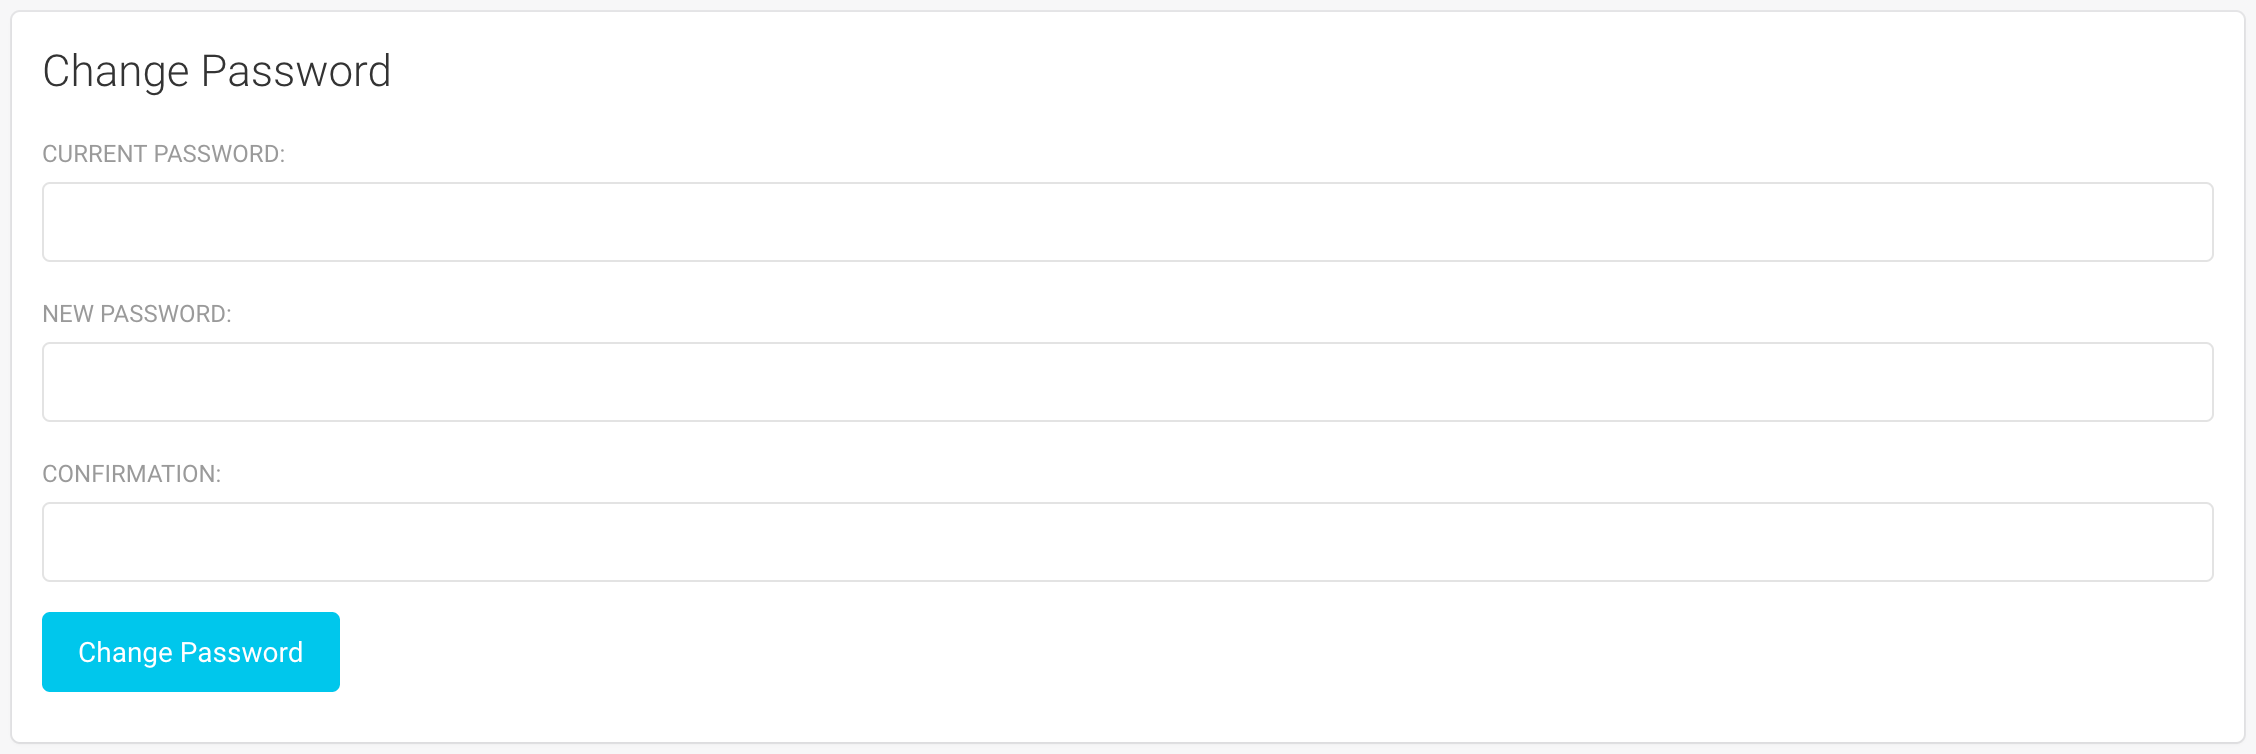
Finally, you can change your password. Note that FAME will only accept strong passwords.